
Fig. 2.
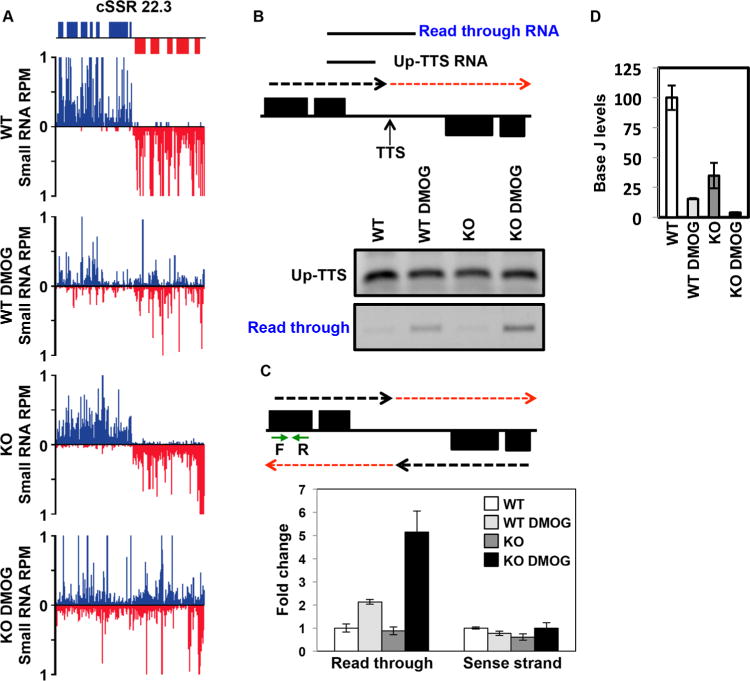
H3.V does not promote transcription termination in L. major.
A. Small RNA-seq reads for a representative cSSR (22.3) are shown where J loss leads to read through transcription, but loss of H3.V does not. Small RNA reads are plotted as reads per million reads mapped (RPM). ORFs are shown above the graphs. The genomic location shown includes position 488–528 kb on chromosome 22. WT: wild type; WT DMOG; WT+DMOG; KO: H3.V KO; KO DMOG: H3.V KO+DMOG. Blue: top strand; red: bottom strand.
B. Strand-specific RT-PCR analysis. Above, schematic representation (not to scale) of cSSR 22.3 illustrating the nascent RNA species assayed by RT-PCR. The dashed red arrow indicates read through transcription past the transcription termination site (TTS). Up-TTS: RNA species upstream of the TTS; Read through RNA: RNA species resulting from read through transcription. Below, cSSR 22.3 was analyzed in WT and H3.V KO cells in the absence and presence of 5mM DMOG.
C. Strand-specific RT-qPCR analysis. Above, schematic representation of cSSR 22.3 as described in panel B. Green arrows indicate the location of primers utilized for strand-specific RT-qPCR analysis. Below, strand-specific RT-qPCR. Read through transcription on the bottom strand was quantitated by performing site-specific cDNA synthesis using primer F illustrated in the diagram above, followed by qPCR using primers F and R. Abundance was normalized using beta tubulin (a gene specific primer against beta tubulin was added to the same cDNA synthesis reaction with primer F, followed by qPCR using beta tubulin primers). White bars: WT; light grey bars: WT+DMOG; dark grey bars: H3.V KO; black bars: H3.V KO+DMOG. Data are plotted as fold change, with WT set to one. Strand-specific RT-qPCR was performed in triplicate, with error bars indicating standard deviation. RNA from the sense strand was similarly quantitated by generating cDNA using primer R, followed by qPCR with primers F and R. Analysis of the sense strand provides a negative control for the strand-specific nature of the assay as well as indicating no change in sense RNA levels following readthrough transcription on the opposing strand.
Increased read through in WT+DMOG and H3.V KO+DMOG relative to WT is statistically significant as determined by a two-tailed Student’s t-test at a P-value <0.05.
D. The amount of read through transcription correlates with the extent of J loss. The levels of J at the TTS in cSSR 22.3 was analyzed by anti-J IP-qPCR for the indicated cell lines as described in Fig. 1C. WT level is set to 100%. Reduction of J is statistically significant in the WT+DMOG, H3.V KO, and H3.V KO+DMOG conditions relative to WT. Increased J reduction in H3.V KO+DMOG compared to WT+DMOG cells is also statistically significant. All statistical significance was determined using two-tailed Student’s t-test and a P-value <0.05.