Fig. 5.

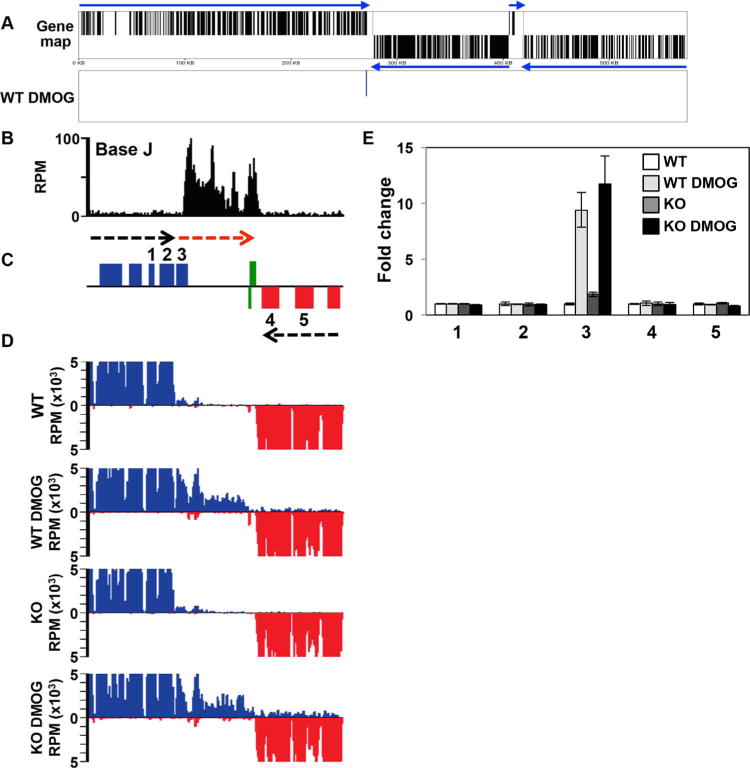
Decreased efficiency of RNAP II termination and increased gene expression following the loss of J.
A. Gene map of chromosome 9 is shown. mRNA coding genes on the top strand are indicated by black lines in the top half of the panel, bottom strand by a line in the bottom half. Genes on the top strand are transcribed from left to right and those on the bottom strand are transcribed from right to left, indicated by blue arrows. Panel below (WT DMOG) indicates the location of the single mRNA found upregulated by at least twofold or more in WT cells treated with DMOG relative to WT. No other expression changes (up or downregulated) were detected.
B–D. A region on chromosome 9 from 263 to 285kb where J regulates transcription termination and gene expression at a cSSR is shown. (B) Base J localizes at the site of RNAP II termination within the gene cluster (prior to the last gene before the cSSR). Base J IP-seq reads are plotted as reads per million (RPM), as previously described (Reynolds et al., 2016). (C) ORFs are shown with the top strand in blue and the bottom strand in red. The red arrow indicates read through transcription following the loss of J. Green boxes indicate RNAP III transcribed genes (tRNA and 5S rRNA). (D) mRNA-seq reads from the indicated cell lines are mapped as described in Fig. 4A and B.
E. Plot of the mRNA-seq data for the genes numbered in the ORF map in panel B, as described in Fig. 4C and D. The upregulated gene, 3, is LmjF.09.0690.
