Fig. 6.

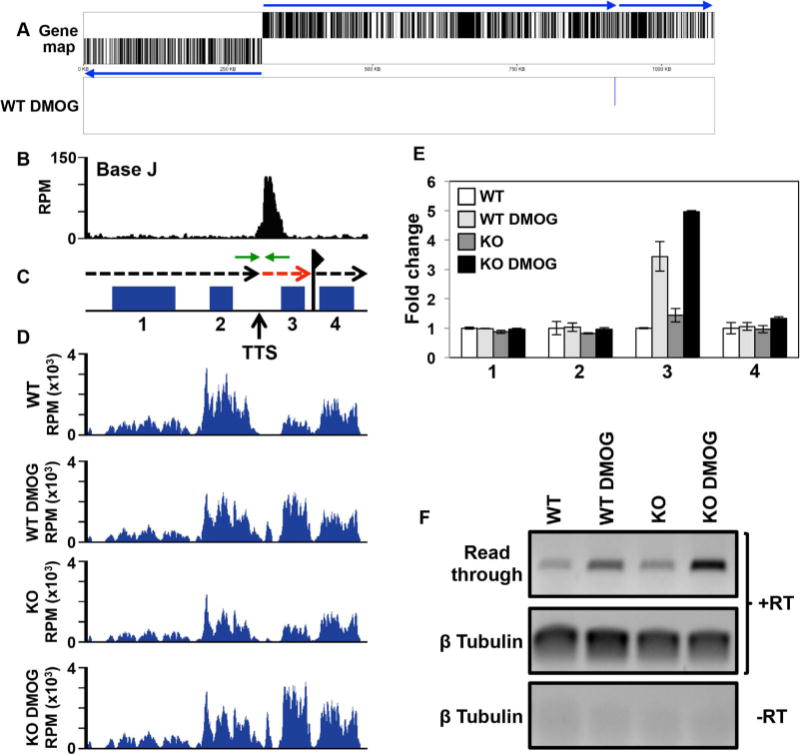
Base J regulates RNAP II termination and gene expression at head-tail regions within gene clusters.
A. Gene map of chromosome 26 is shown where loss of J leads to upregulation of a single mRNA at the end of a gene cluster at a head-tail region. Labeling is as described in Fig. 5A.
B–D. Base J IP-seq reads, ORFs, and mRNA-seq reads are plotted for the head-tail region on chromosome 26 from 912 to 922 kb, as described in Fig. 5. (B) Base J localizes at the transcription termination site (TTS). The vertical arrow indicates the proposed TTS as described in the text (Reynolds et al., 2014, 2016). The black dashed arrow above the map indicates the direction of transcription and the dashed red arrow indicates read through transcription past the TTS. The flag indicates the transcription start site for the downstream gene cluster as indicated by H3 acetylation localization (Thomas et al., 2009). Green arrows flanking the TTS represent the PCR oligos utilized in strand-specific RT-PCR.
E. Plot of the mRNA-seq data for the genes numbered in the ORF map in panel B, as described in Fig. 4C and D. The upregulated gene, 3, is LmjF.26.2280.
F. Strand-specific RT-PCR analysis of read through transcription at the TTS analyzed in B–E. Above the gene map in panel C is a schematic representation (not to scale) of primer location and direction at the TTS. cDNA was synthesized using the reverse primer (relative to transcription) and RNA from WT and H3.V KO cells treated with and without DMOG. Read through was detected by PCR using the same reverse primer used to make the cDNA plus the forward primer, as indicated. Tubulin provides a positive control and a minus RT (-RT) negative control is shown.
