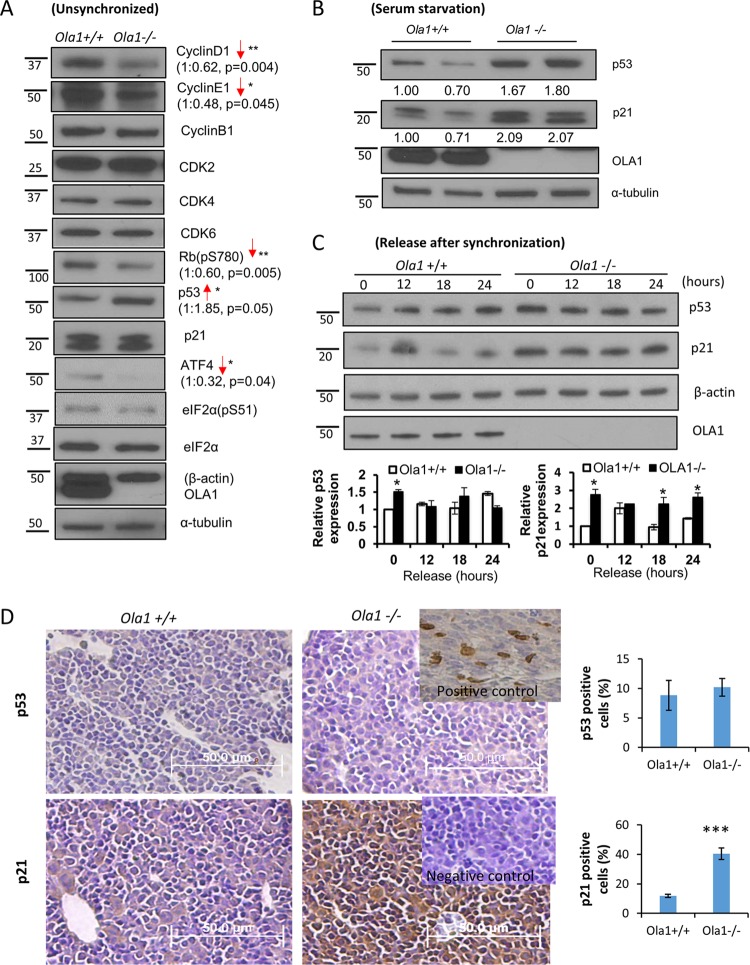
FIG 5.
Alterations in cell cycle regulators in OLA1 knockout MEFs. (A) Levels of cell cycle regulators and related proteins in Ola1+/+ and Ola1−/− MEFs were analyzed using immunoblotting. α-Tubulin was used as the loading control. *, P < 0.05; **, P < 0.01 (n = 3). (B) Levels of p53, p21, and OLA1 proteins in Ola1+/+ and Ola1−/− MEFs following overnight serum starvation were evaluated using immunoblotting. α-Tubulin was used as the loading control. (C) Levels of p53 and p21 proteins in Ola1+/+ and Ola1−/− MEFs that were serum starved for 24 h and restored with serum at the indicated times are shown. β-Actin was used as the loading control. Quantitative analyses of the relative band intensities are shown as bar graphs (means ± SDs) under the gel images. *, P < 0.05 (n = 3). Numbers on the left in panels A to C are molecular masses, in kilodaltons. (D) Expression of the p53 and p21 proteins in E12.5 embryos as shown by IHC staining of liver sections with a p53 antibody (top) or a p21 antibody (bottom). (Upper right inset) Positive control showing p53 staining in a liver section obtained from an E18.5 WT embryo. (Lower right inset) Negative control showing p21 staining in an adjacent section stained without the primary antibody. The percentages of cells staining positive for p53 or p21 are shown as bar graphs. Error bars show SEMs. ***, P < 0.001 (n = 6).

