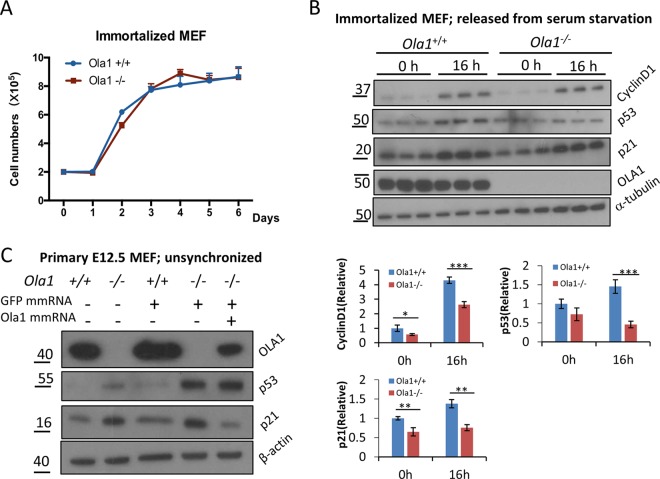
FIG 6.
Analysis of cell growth and levels of cyclin D1, p53, and p21 in immortalized MEFs. (A) Growth curves for immortalized Ola1+/+ and Ola1−/− MEFs. Data are presented as the means ± SDs (n = 3). (B) Analysis of cyclin D1, p53, and p21 levels in immortalized MEFs. The levels of cyclin D1, p53, p21, and Ola1 proteins in a pair of immortalized Ola1+/+ and Ola1−/− MEFs that were serum starved overnight and then restored using serum for 0 h and 16 h were analyzed using immunoblotting analysis. α-Tubulin was used as the loading control. Quantitative analyses of the relative band intensities for each protein are shown as bar graphs under the gel images. Data are presented as the means ± SDs. *, P < 0.05; **, P < 0.01; ***, P < 0.001 (n = 3). (C) Restoration of Ola1 expression reverses the accumulation of p21 but not the accumulation of p53. Ola1−/− MEFs were transfected with Ola1 mmRNA and/or GFP mmRNA, and the levels of the p53 and p21 proteins were detected using immunoblotting analysis.

