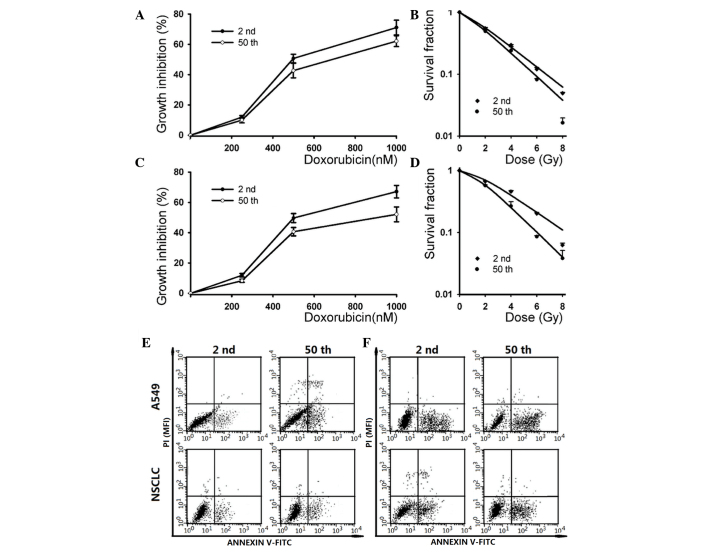
Figure 4.
The SP fraction derived from different passage cells displayed distinct chemo- and radio-sensitivity. (A) SP cells from A549 cells were treated with different concentrations of doxorubicin (0, 250, 500 and 1,000 nM), and cytotoxicity was determined by SRB assay (*P<0.05). (B) SP cells within A549 cells were irradiated with a dose of 0, 2, 4, 6 and 8 Gy. The survival curves represent the data as fitted by the single-hit multi-targets model (*P<0.05). (C) SP cells from NSCLC cells were treated with different concentrations of doxorubicin (0, 250, 500 and 1,000 nM), and cytotoxicity was determined by SRB assay (*P<0.05). (D) SP cells within NSCLC cells were irradiated with a dose of 0, 2, 4, 6 and 8 Gy. The survival curves represent the data as fitted by the single-hit multi-targets model (*P<0.05, **P<0.01). SP cells were (E) exposed to 2 Gy irradiation or (F) pretreated with 500 nM doxorubicin for 12 h, and the apoptosis rate was determined by annexin V-FITC/propidium iodide staining. NSCLC, non-small cell lung cancer; PI, propidium iodide; SP, side population; SRB, sulforhodamine B; FITC, fluorescein isothiocyanate; MFI, mean fluorescence intensity.

