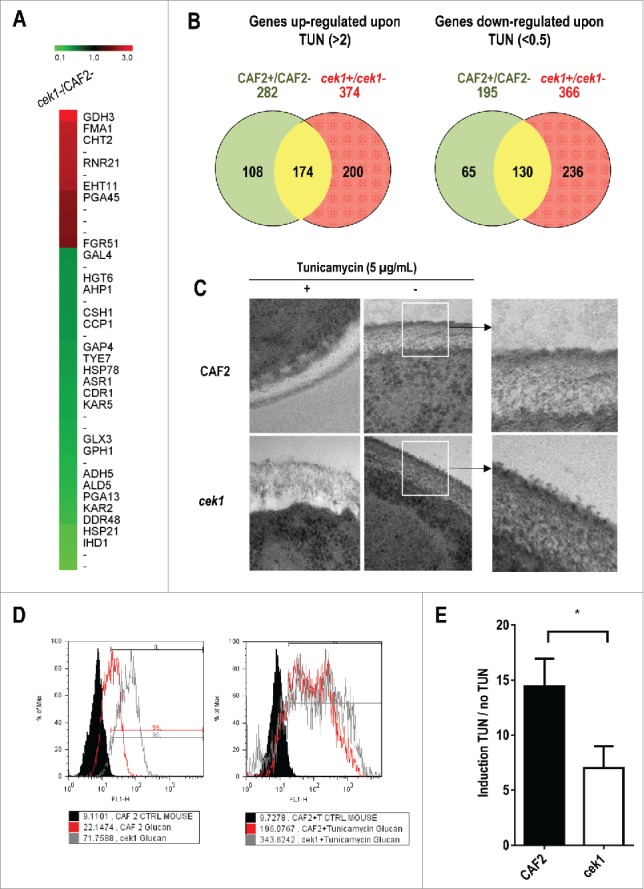
Figure 1.

Analysis of the effect of tunicamycin treatment on C. albicans transcriptional response and on cek1 cell wall. (A) Heat map showing differentially expressed genes in cek1 versus CAF2 cells under basal (exponentially growing, not treated with tunicamycin) conditions. (B) Venn diagrams showing up‑ and down‑regulated genes (left and right panel, respectively) upon 2 hours treatment of wild type (CAF2) and cek1 mutant with tunicamycin (TUN). Specific genes to the wild type strain or cek1 mutant are shown in green or red respectively, while commonly regulated genes are represented in yellow. (C) Cells from a stationary culture were diluted in fresh pre‑warmed YEPD or YEPD supplemented with tunicamycin (5 μg/mL), and grown at 37ºC for 2 hours before being collected and processed for TEM analysis. Magnifications of wt and cek1 untreated cells are shown to the right. (D) A representative histogram of cells´ β‑glucan exposure at the end of the experiment (2h). (E) Fold induction of β‑glucan exposure after tunicamycin treatment vs no treatment (induction TUN / no TUN). * indicates p < 0.05 (p = 0.028) as determined using an independent t-Student's test (n = 3).
