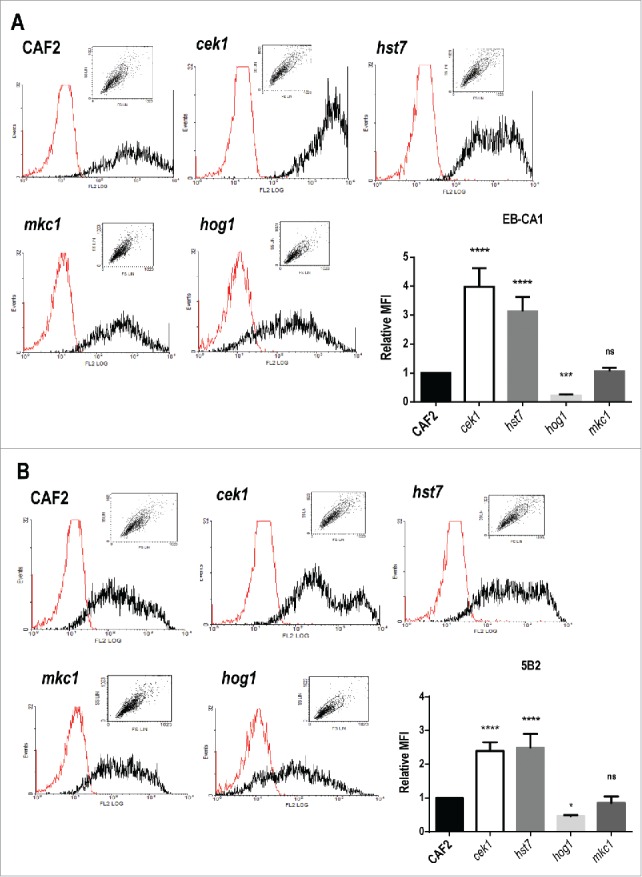
Figure 2.

Levels of α‑ and β‑mannosides at the cell wall surface of strains defective in elements from the MAPK signaling network. Cells from stationary cultures of CAF2, cek1, hst7, mkc1 and hog1 mutants were analyzed by flow cytometry to detect the levels of α‑1,2‑ and β‑1,2‑mannosides (α‑M and β‑M), recognized by the specific antibodies EB‑CA1 (A) and 5B2 (B) respectively. Representative histograms (the red histogram refers to samples treated only with the secondary antibody) and mean fluorescence intensities (MFI) from three independent experiments with the corresponding standard deviation are shown. One way ANOVA followed by Dunnet's correction for multiple comparisons was applied to evaluate differences between mutants and wild type strain (*p < 0.05, **p < 0.01, ***p < 0.001, ****p < 0.0001). MFI absolute values for CAF2 cells were 665.8 (A) and 170.8 (B).
