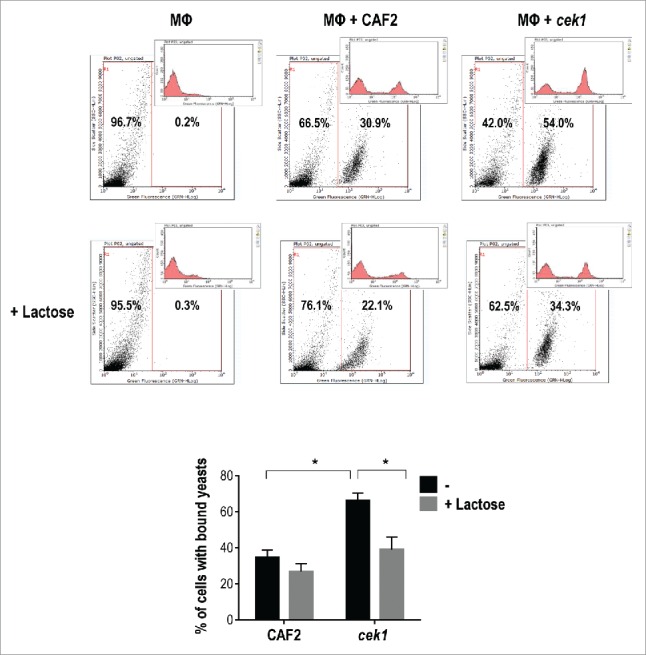
Figure 4.

Lactose blockage of C. albicans binding to murine macrophages. Representative flow cytometry analysis of CAF2 and cek1 (marked with FITC) binding to murine macrophages (MΦ – Raw 264.7 cell line) at MOI 10:1 (yeast: MΦ) and 30 min. interaction time on ice. Blockage with lactose (100 mM) was made 30 min. prior infection. The graphic shows the percentage of bound yeasts from independent experiments (n = 4). * p < 0.05.
