Figure 5.
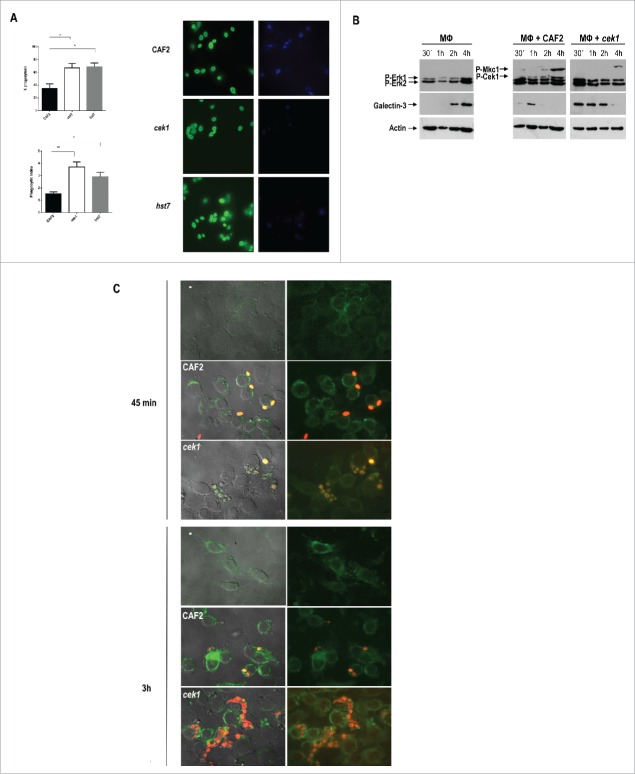
Analysis of galectin‑3 expression by murine macrophages upon interaction with C. albicans cells. (A) Phagocytosis by murine macrophages of the cek1 and hst7 mutants vs. the CAF2 wild type strain. Percentage of phagocytosed fungal cells (Upper subfigure) or Phagocytic index (Lower subfigure) assessed by counting number of internalized yeast per 100 phagocytes (at least 10 fields on each immunofluorescence carried out in duplicate). Data from phagocytic assays were collected in at least 3 independent experiments. (*p < 0.05, ** p < 0.01). Fluorescent microscopy images showing extracellular yeast (blue) and both extra and intracellular yeast (green) are shown. (B) Immunodetection analysis of cells recovered from interaction studies between C. albicans and murine macrophages. Wild type (CAF2) or cek1 mutant cells were added to a confluent monolayer of macrophages (Raw 264.7 – MΦ) at MOI 10:1 (yeast: MΦ) and let to interact at 37ºC. Cells were collected at the indicated time-points and treated for immunoblot detection of MAPKs and ERKs activation pattern (anti-phospho-p44/42) as well as for detection of galectin‑3 expression (anti‑galectin‑3). Anti-actin was used as loading control. (C) Immunofluorescence microscopy analysis of C. albicans cells (CAF2 and cek1) interacting with murine macrophages (MOI: 1:1, yeast: MΦ). Yeast cells are constitutively expressing RFP (visible in red) while galectin‑3 is visible in green. Right pictures are fluorescence merged images of green and red channels, while left pictures include the phase contrast image for clarity. Control macrophages without Candida cells are shown as -.

