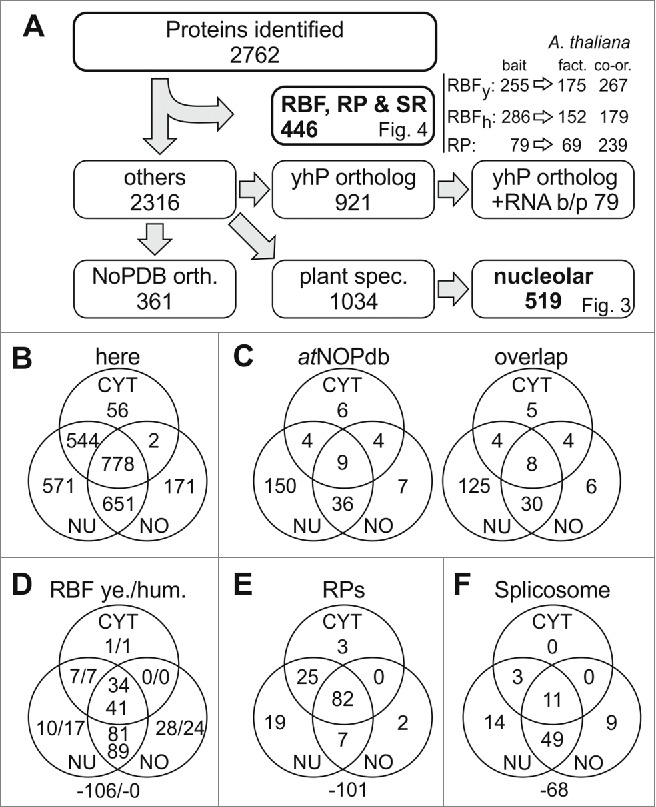
Figure 2.

Classification of identified proteins. (A) Shown is the procedure of data processing. Identified proteins are listed in Table S1, identified co-orthologues to RBFs in yeast and humans in Table S2; to RPs in Table S4 and spliceosomal proteins in Table S5. For each pool the number of proteins is indicated and the according figure is referred to. The protein accessions of identified orthologues to proteins deposited in nucleolar database for human (NoPDB) are listed in Table S6, the sequences orthologous to other yeast and human proteins (yhP) are listed in Table S7,8. (B) Shown is the number of proteins discovered in the 3 different fractions. (C) Shown is the number of proteins in the 3 different compartments in the atNOPdb (left) and the number thereof found in our proteomic study (right). (D) Shown is the number of proteins identified in the 3 different fractions analyzed by proteomics with ortholog search to yeast RBFs (left) or human RBFs (right). The number outside the Venn-diagram gives the co-orthologues identified in the A. thaliana genome but not found here. (E, F) Shown is the proportion of found RPs (E) and splicing factors (F) in the various fractions. CYT, cytosol; NU, nucleus; NO, nucleolus.
