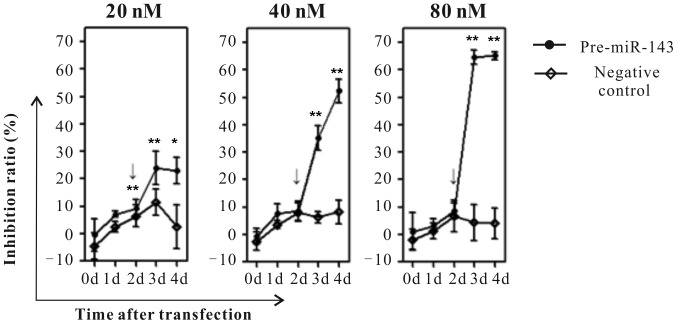
Figure 2.
Impact of miR-143 overexpression on HeLa cell growth. The X-axis arrow indicates the time points (in days) when the cells received pre-miRNA-143 or negative control (20, 40 and 80 nM) transfection. Relative cell growth, indicated on the Y-axis, was measured by 3-(4,5-dimethylthiazol-2-yl)-2,5-diphenyltetrazolium bromide assay. Data represent the mean ± standard error of two independent experiments, with each condition performed in triplicate. *P<0.05, **P<0.01 compared with the negative control. miR, microRNA; pre-miR-143, precursor miR-143.

