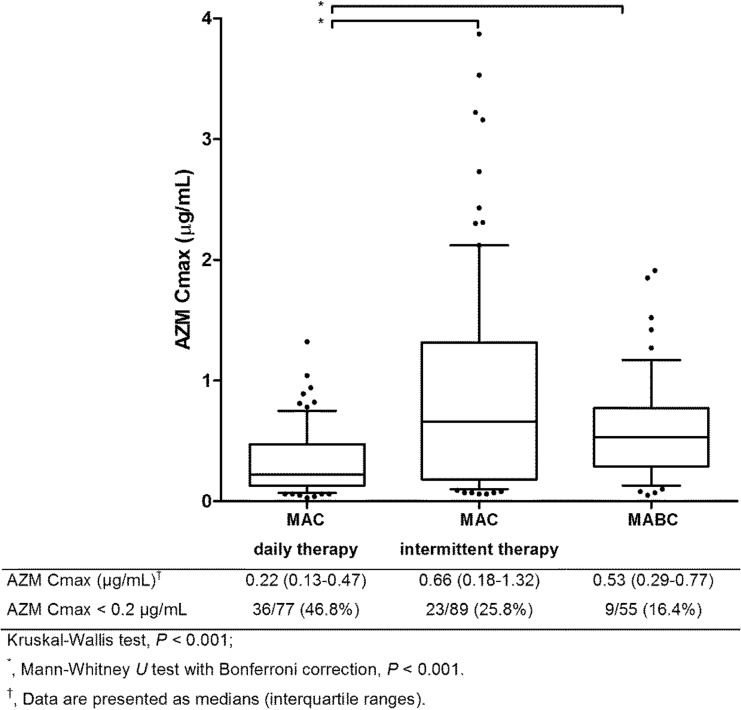
FIG 2.
A box-and-whisker plot of peak plasma azithromycin concentrations. The bottom and top of each box indicate the 25th and 75th percentiles, respectively, and the line within each box indicates the median. The whiskers indicate the 10th and 90th percentiles. AZM Cmax, peak plasma azithromycin concentrations; MABC, M. abscessus complex; MAC, M. avium complex.

