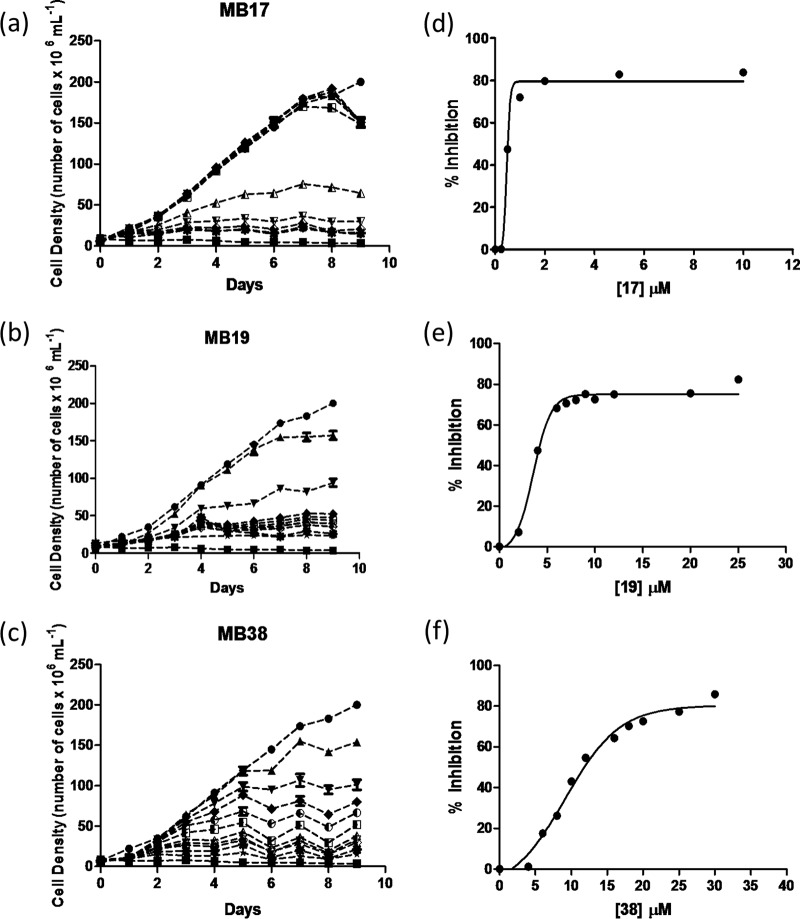
FIG 2.
Growth curve of epimastigote forms of T. cruzi. Growth curves in the presence of different concentrations of MB17 (a), MB19 (b), or MB38 (c) and dose-response curves (d, e, and f) in the presence of different concentrations of compounds. Treatments were performed with MB17 (a and d), MB19 (b and e), and MB38 (c and f). ●, 0 μM; ◽, inhibition control (0.5 μM antimycin and 60 μM rotenone); ▲, 0.005 μM (MB17), 2 μM (MB19), 4 μM (MB38); ▼, 0.025 μM (MB17), 4 μM (MB19), and 6 μM (MB38); △, 0.05 μM (MB17), 6 μM (MB19), and 8 μM (MB38); ▽, 0.1 μM (MB17), 7 μM (MB19), and 10 μM (MB38); ◆, 0.25 μM (MB17), 8 μM (MB19), and 12 μM (MB38); ♢, 0.5 μM (MB17), 9 μM (MB19), and 16 μM (MB38); ■, 1 μM (MB17), 10 μM (MB19), and 18 μM (MB38); ○, 2 μM (MB17), 12 μM (MB19), and 20 μM (MB38); X, 5 μM (MB17), 20 μM (MB19), and 25 μM (MB38); ⭑, 10 μM (MB17), 25 μM (MB19), and 30 μM (MB38).

