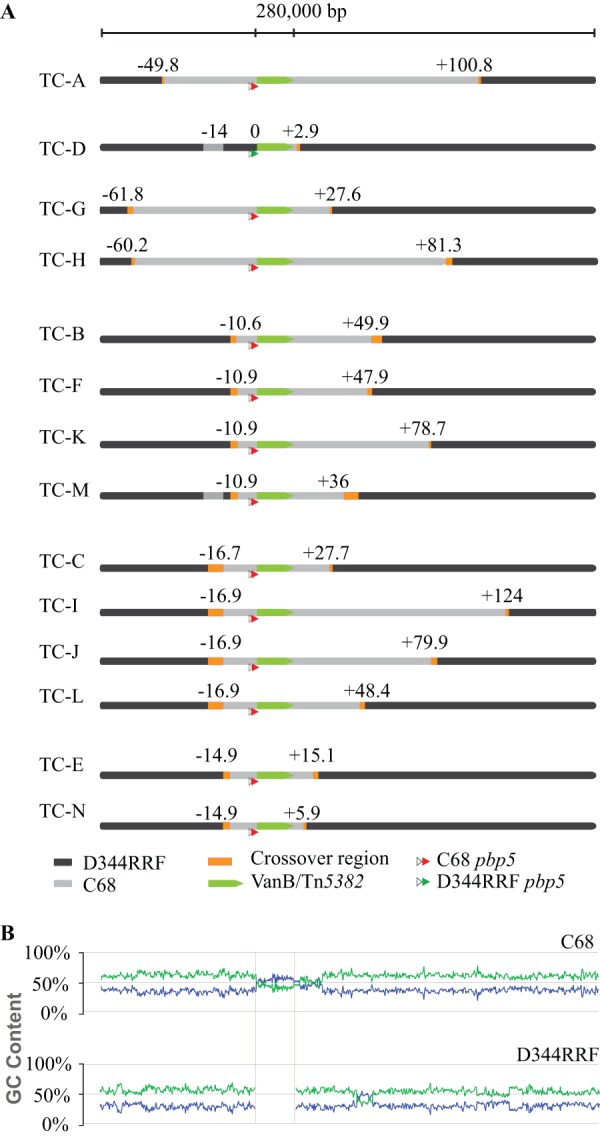
FIG 3.

Crossover regions. (A) Cartoon representation of crossover regions in all individual transconjugants. The area of the crossover is measured from the last SNV corresponding to the donor strain, C68, to the first SNV corresponding to the recipient strain, D344RRF. Transconjugants are organized by groups with shared left crossover regions. Notice the additional crossover regions in TC-D and TC-M (light gray). The amount of chromosomal DNA integrated in addition to Tn5382 is measured from the left or right end of the element up to the last SNV between D344RRF and each transconjugant. The amount of integrated DNA is shown in kilobases. (B) Plot of GC and AT contents of C68 (donor) and D344RRF (recipient) in the chromosomal region where crossovers occurred. Blue, GC content; green, AT content. The high-GC-content area in C68 corresponding to Tn5382 carrying vanB is highlighted between red lines.
