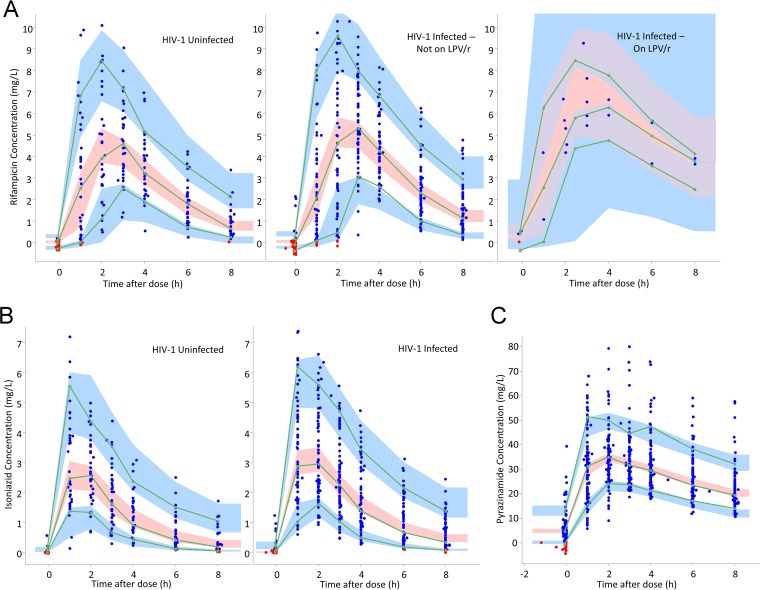
FIG 1.
(A) Visual predictive check for rifampin concentration versus time, stratified by HIV-1 serostatus and coadministration of lopinavir/ritonavir (LPV/r). The blue dots are observed concentrations, and the red dots are simulation-based values below the limit of quantification (BLQ). Lines are 10th, 50th, and 90th percentiles for observed data, while the shaded areas represent the 90% confidence intervals for the same percentiles, as predicted by the model. (B) Visual predictive check for isoniazid concentration versus time, stratified by HIV-1 serostatus. The blue dots are observed concentrations, and the red dots are simulation-based values below the limit of quantification (BLQ). Lines are 10th, 50th, and 90th percentiles for observed data, while the shaded areas represent the 90% confidence intervals for the same percentiles, as predicted by the model. (C) Visual predictive check for pyrazinamide concentration versus time. The blue dots are observed concentrations, and the red dots are simulation-based values below the limit of quantification (BLQ). Lines are 10th, 50th, and 90th percentiles for observed data, while the shaded areas represent the 90% confidence intervals for the same percentiles, as predicted by the model.

