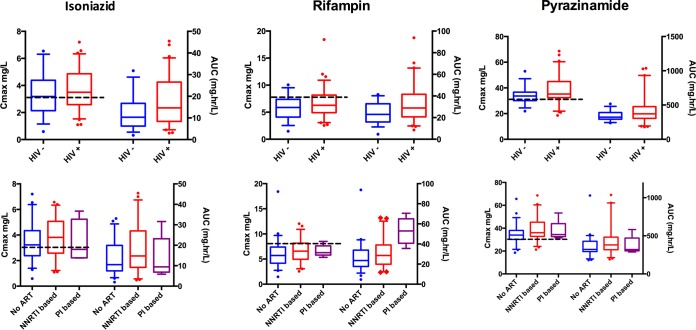
FIG 2.
Pharmacokinetic measures Cmax and AUC0–24, stratified by HIV serostatus and antiretroviral therapy regimen. The box-and-whisker plots show model-derived PK measures. Cmax and AUC0–24 are plotted on the left and right y axes, respectively. The boxes show medians and interquartile ranges. The whiskers represent the 5th to 95th percentiles and illustrate the variability in both HIV-1-infected (+) and HIV-1-uninfected (−) patients and different antiretroviral therapy categories. Patients on inhibitors appeared to have higher rifampin AUC0–24 values than patients in the no-ART and NNRTI-based categories. The dotted black lines indicate the current recommended thresholds for Cmax of 3 mg/liter, 8 mg/liter, and 30 mg/liter for isoniazid, rifampin, and pyrazinamide, respectively. No tests for statistical significance were run to generate P values for these post hoc individual estimates, as the reported individual values are based on the population PK models and are hence interdependent. The significance of the respective covariate effects (Tables 2 to 4) was tested within the model. Abbreviations: ART, antiretroviral therapy; NNRTI, nonnucleoside reverse transcriptase inhibitor; PI, protease inhibitor; Cmax, maximum concentration; AUC, area under the curve from 0 to 24 h.

