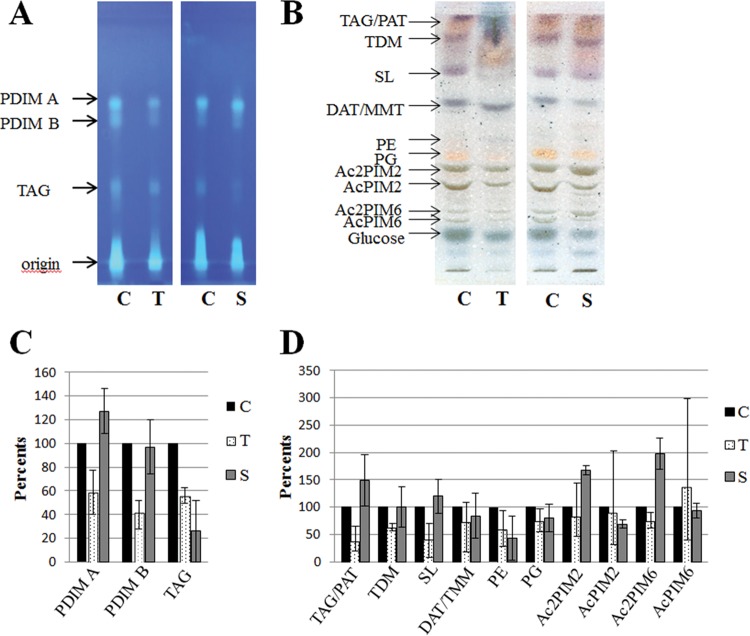
FIG 3.
Lipid modifications detected in M. tuberculosis treated with THL (lanes T) or simvastatin (lanes S) compared to the DMSO control (lanes C). (A) HPTLC analysis of PDIM A, PDIM B, and TAG separated with petroleum ether-diethyl ether (9:1 [vol/vol]) and visualized by primuline. (B) HPTLC analysis of lipids separated with CHCl3-CH3OH-H2O (60:35:8 [vol/vol/vol]), visualized by spraying with a 0.2% anthrone solution (wt/vol) in concentrated H2SO4, followed by heating. (C) Lipid quantification of PDIM A, PDIM B, and TAG based on colorimetric and fluorometric analysis of TLC. (D) Lipid quantification of representative lipids based on colorimetric and fluorometric analysis of TLC. In each graph, means ± the standard error bars of three independent experiments, converted to a percentage, with untreated samples taken as 100%, are shown. For THL-treated or simvastatin-treated samples versus untreated samples, three independent experiments were analyzed by TLC and quantified.

