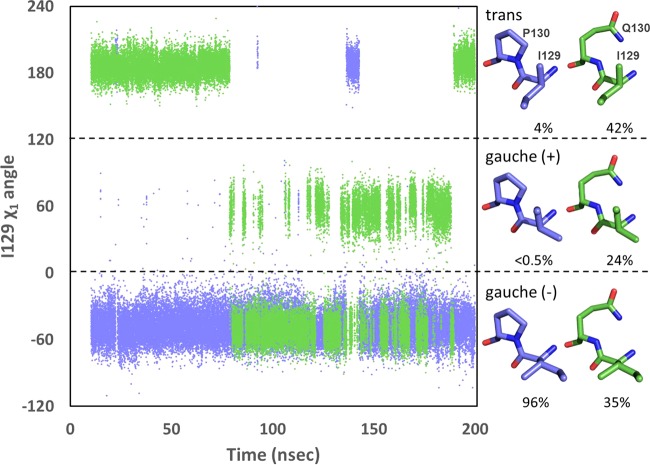
FIG 4.
Rotamer position of I129 in OXA-66 and OXA-109. The χ1 torsion angle for I129 was plotted as a function of time for OXA-66 (blue) and OXA-109 (green). Rotamers (approximate structures shown at right) were binned as follows: gauche (−), −120° < χ1 <0°; gauche (+), 0° < χ1 <120°; trans, −180° < χ1 < −120° and 120° < χ1 <180°. For purposes of clarity, χ1 values between −120° and −180° were shifted to the top of the graph by adding 360°.

