FIG 4.

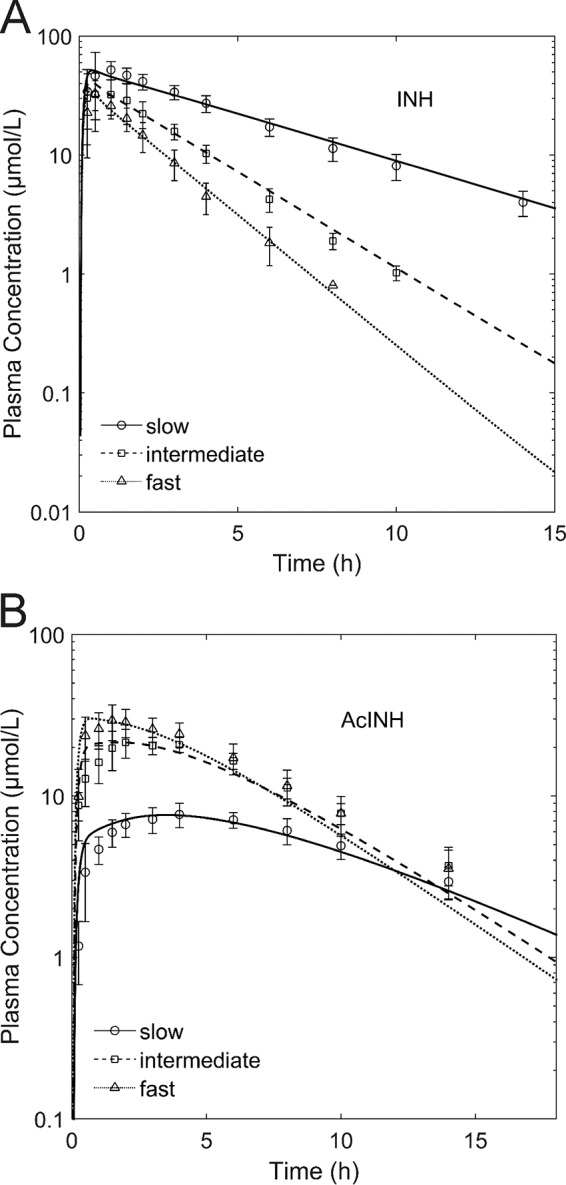
Validation of NAT2 phenotype-dependent INH (A) and AcINH (B) PK. Results of a simulation with a QD oral dose of 300 mg INH are shown as lines, and experimental data (50) are shown as symbols.

Validation of NAT2 phenotype-dependent INH (A) and AcINH (B) PK. Results of a simulation with a QD oral dose of 300 mg INH are shown as lines, and experimental data (50) are shown as symbols.