
FIG 3.
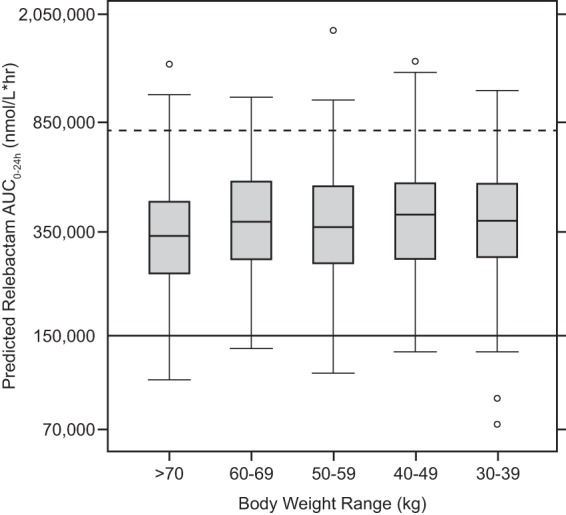
REL exposures (AUC0–24) in adults at a dose of 250 mg q6h across different body weight ranges. Boxes represent the median and 25th and 75th percentiles. Whiskers represent the 5th and 95th percentiles. Data points represent individual outlier values. The dashed horizontal line represents the upper bound of the therapeutic window for the median. The solid horizontal line represents the lower bound for the median.