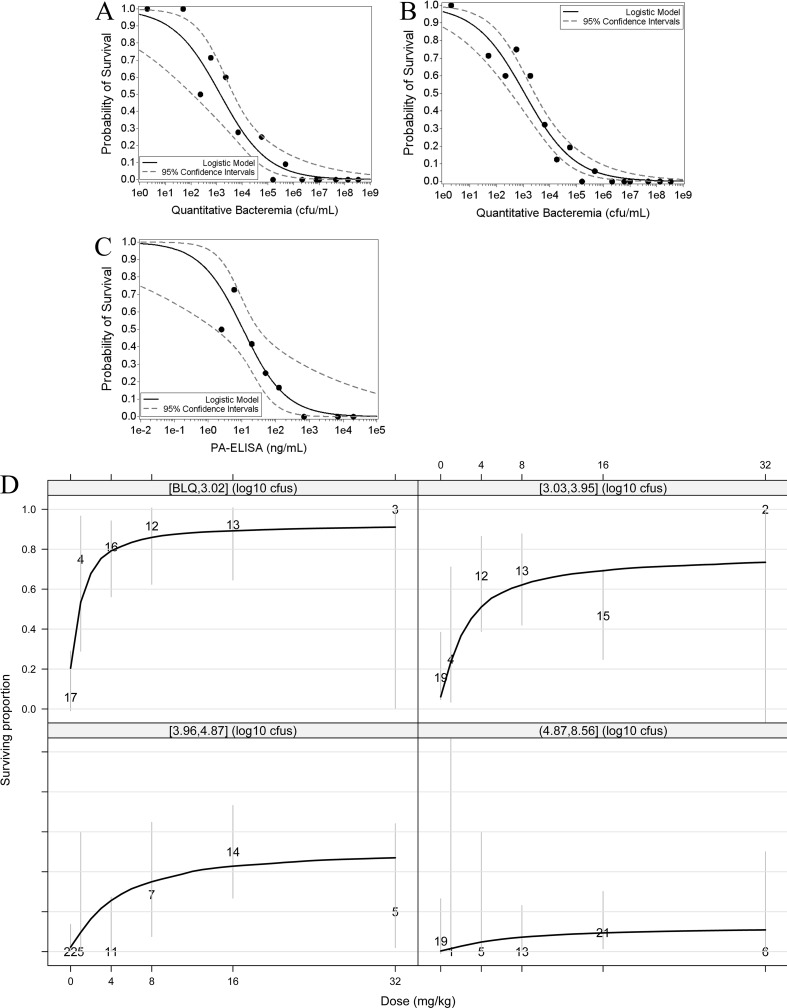
FIG 4.
Levels of bacteremia and toxemia at the time of toxin neutralization are prognostic of survival following antitoxin monotherapy. Shown are logistic regression analyses describing the relationship between survival and bacteremia (A and B) or survival and toxemia (C) for animals in studies M1 to M4 treated with obiltoxaximab at 16 mg/kg (A and C) or all doses (4 to 32 mg/kg) (B). Filled circles indicate the proportion of animals that survived within each half-log bin. Control animals were not included in the analyses shown in panels A to C. Panels A and B include data from studies M1 to M4, and panel C includes data from studies M2 to M4. (D) Shown are dose-response relationships after stratifying by level of pretreatment bacteremia. The four quadrants represent quartiles of the PTT bacteremia distribution across 5 studies (rabbit study R1 and cynomolgus macaque studies M1 to M4). Bacteremia levels in each quartile are shown on top of each quadrant. Numbers on the plot indicate the total number of animals comprising each observed mean data point, and the solid black line represents the prediction based on modeling of survival data. Gray vertical lines represent 95% confidence intervals. CFU, CFU/ml; BLQ, below the limit of quantitation.

