. 2016 Jul 28;4(9):1381–1391. doi: 10.1039/c6bm00214e

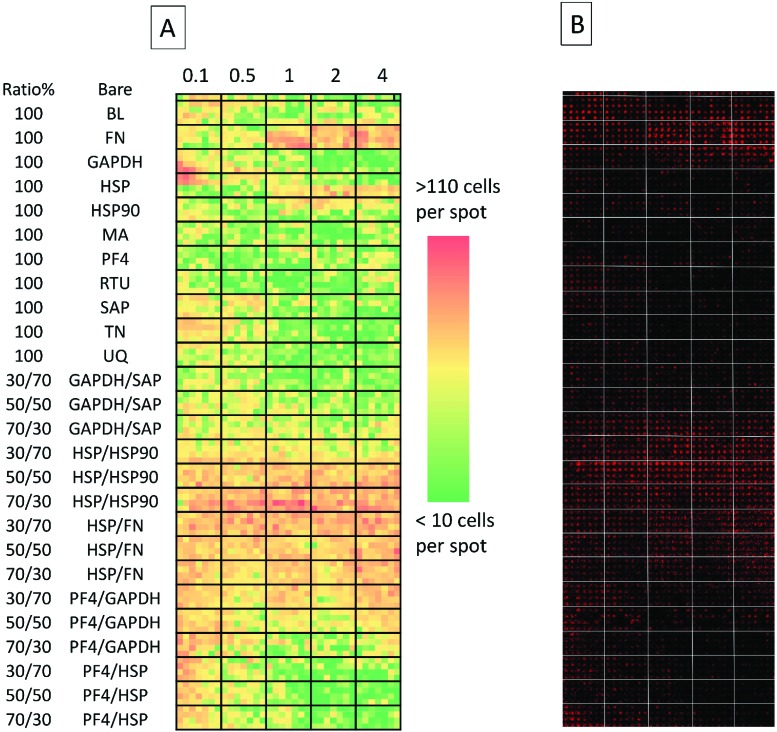
Fig. 2. (A) Collated images of secondary screen. From left to right: heat map representative of cell attachment is shown (red signifies high number of cells, green signifies a low number of cells). Top row depicts cell adherence on non-spotted N-(4-hydroxyphenyl) methacrylamide surfaces. Columns are separated by bold black lines; from left to right: the first columns depicts cell adherence on surfaces spotted with 0.1 fmol, followed by cell adherence on 0.5, 1, 2 and 4 fmol. Rows (separated by horizontal black lines) represent either different proteins spotted on the surface or different co-adsorbed ratios of the same proteins. Each ‘block’ within the emboldened black borders depict replicates which are 7 spots across and 4 spots down (making for 28 replicates) and (B) detection of Oct-4 expressing cells on the array using Cy3 labelled antibody, each spot acquired separately and stitched together). BL = Beta-lactoglobulin, TN = tetranectin, PF4 = platelet factor 4, GAPDH = glyceraldehyde-3-phosphate dehydrogenase, MA = agrin, UQ = ubiquitin, HSP90 = heat shock protein 90, HSP = heat shock protein-1-like, SAP = serum amyloid P, FN = fibronectin and RTU = reticulon 4 interacting protein 1.

Fig. 2