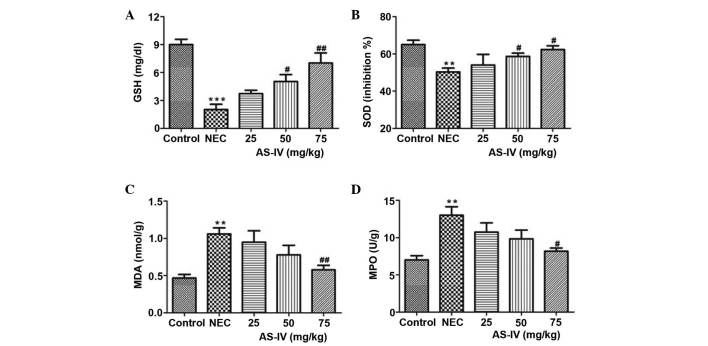
Figure 2.
(A) GSH, (B) SOD, (C) MDA and (D) MPO concentrations in the distal ileum of rats after 4 days of treatment. Data are presented as the mean ± standard error of the mean in each group (n=10), **P<0.01, ***P<0.001, vs. the control group; #P<0.05, ##P<0.01, vs. the model group. GSH, glutathione; SOD, superoxide dismutase; MDA, malondialdehyde; MPO, myeloperoxidase; NEC, necrotizing enterocolitis; AS-IV, astragaloside IV.

