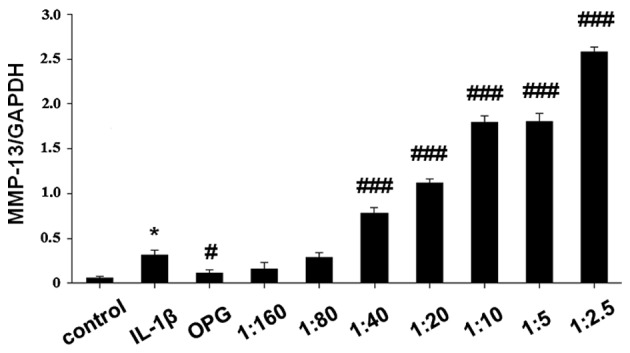
Figure 2.

Relative mRNA expression levels of MMP-13 in IL-1β-stimulated SW1353 cells, normalized to GAPDH. Data are expressed as the mean ± standard deviation. *P<0.05 vs. control; #P<0.05, ###P<0.001 vs. IL-1β-stimulated cells. MMP, matrix metallopeoteinase; OPG, osteoprotegerin; IL-1β, interleukin-1β.
