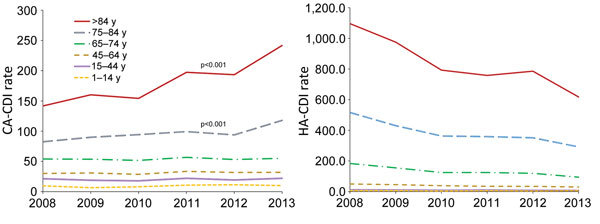
Figure 2.

Trends in CDI rates by age group, Finland, 2008–2013. A) CA-CDI; B) HA-CDI. The decrease in the HA-CDI rate was statistically significant (p<0.001) for all age groups except persons 1–14 years of age. CA, community-associated; CDI, Clostridium difficile infection; HA, healthcare-associated.
