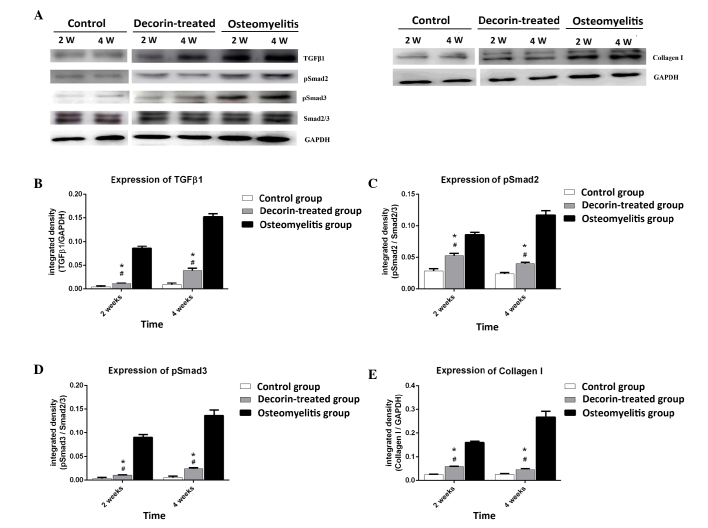
Figure 5.
(A) Immunoblotting analysis in the control, osteomyelitis and decorin-treated groups at weeks (W) 2 and 4 after surgery. The expression levels of (B) TGF-β1, (C) pSmad2, (D) pSmad3 and (E) collagen I are shown as the integrated density against GAPDH or Smad2/3. #P<0.05 vs. the corresponding control group; *P<0.05 vs. the corresponding osteomyelitis group. TGF, transforming growth factor; TβR, TGF-β receptor.

