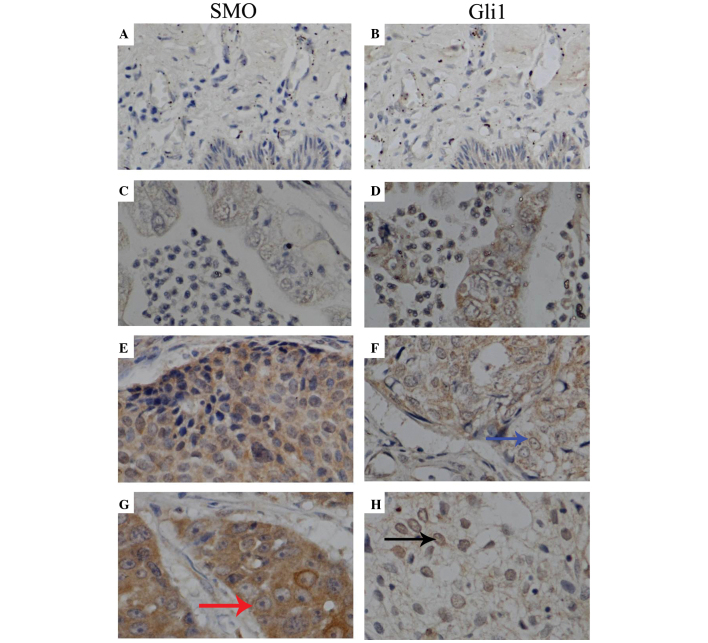
Figure 3.
Overexpression of SMO and GLI1 in cervical cancer. (A) Negative staining of SMO in normal tissue. (B) Negative staining of GLI1 in normal tissue. (C) Increased expression of SMO was observed in adenocarcinoma. (D) GLI1 was highly expressed in adenocarcinoma. (E and G) Increased expression of SMO was observed in squamous cell carcinoma (2 examples). SMO was mainly localized in the cytoplasm of cervical cancer cells (red arrow). (F and H) GLI1 was highly expressed in squamous cell carcinoma (2 examples). GLI1 was expressed in the (F) cytoplasm (blue arrow) and (H) nucleus (black arrow) of cervical cancer cells. Magnification, ×400. SMO, smoothened; GLI1, glioma-associated oncogene 1.

