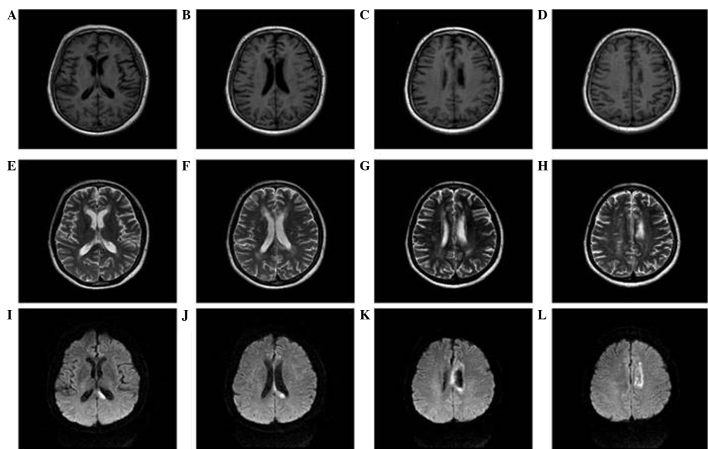
Figure 1.
Multi-modal brain magnetic resonance imaging (MRI). (A and B) T1 hypo-intensity in the splenium of the left corpus callosum. (C and D) T1 hypo-intensity in the body of the left corpus callosum. (E and F) T2 hyper-intensity in the splenium of the left corpus callosum. (G and H) T2 hyper-intensity in body of the left corpus callosum. (I-L) Axial diffusion weighted imaging of MRI. (I and J) Diffusion weighted imaging showed high signal intensity in the splenium of the corpus callosum. (K and L) Diffusion weighted imaging demonstrated high signal intensity in the body of the corpus callosum. All these confirm the infarction of left corpus callosum.

