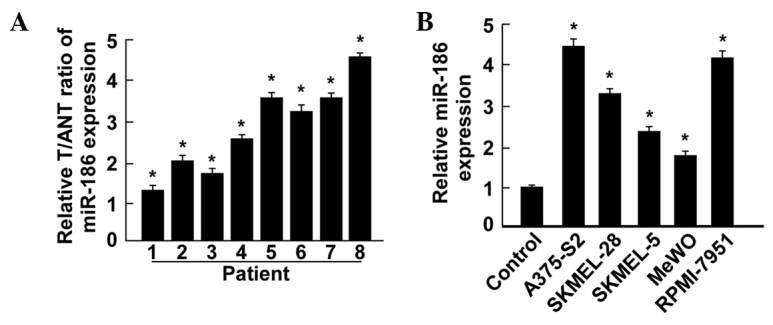
Figure 1.

Expression of miR-186 in human melanoma tissues and cell lines. (A) Relative miR-186 mRNA expression levels in 8 paired Ts and ANTs from patients were detected by PCR analysis. (B) Quantitative PCR analysis of miR-186 expression in the control normal human epidermal melanocytes and melanoma cell lines, consisting of the A375-S2, SKMEL-28, SKMEL-5, MeWO and RPMI-7951 cell lines. Experiments were repeated at least three times. Each bar indicates the mean of three independent experiments. *P<0.05 versus control. T, primary melanoma tissue; ANT, matched adjacent non-tumor tissue; miR-186, microRNA-186; PCR, polymerase chain reaction.
