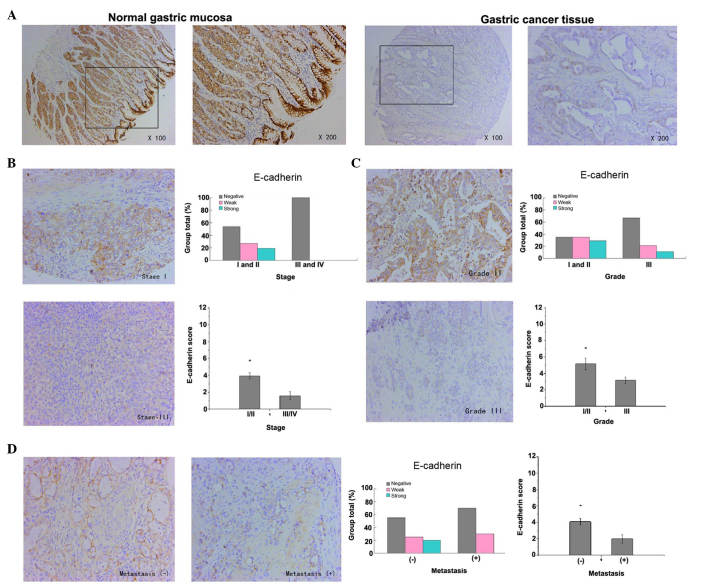
Figure 2.
E-cadherin expression in samples of gastric cancer and its association with pathological features. (A) E-cadherin expression was detected by immunohistochemical analysis of tissue microarrays. Representative images of E-cadherin expression in normal gastric mucosa and gastric cancer tissue are shown (magnification, ×100, and ×200 for the inserts). The staining of E-cadherin in normal gastric mucosa cells was strongly positive, whereas in gastric cancer tissue cells, it was weakly positive or negative. (B) E-cadherin expression was negatively correlated with tumor stage (P=0.029 for stages I and II vs. stages III and IV). Representative images of stage I and III tumors are shown (magnification, ×200). (C) E-cadherin expression was negatively correlated with tumor differentiation (P=0.050 for grades I and II vs. grade III). Representative images of grade II (strongly positive) and III (weakly positive) tumors are shown (magnification, ×200). (D) E-cadherin expression was negatively correlated with lymph node (or distant) metastasis (P=0.037 for non-metastasis group vs. metastasis group). Representative images of gastric cancer with or without metastasis are shown (magnification, ×200).

