Figure 3.
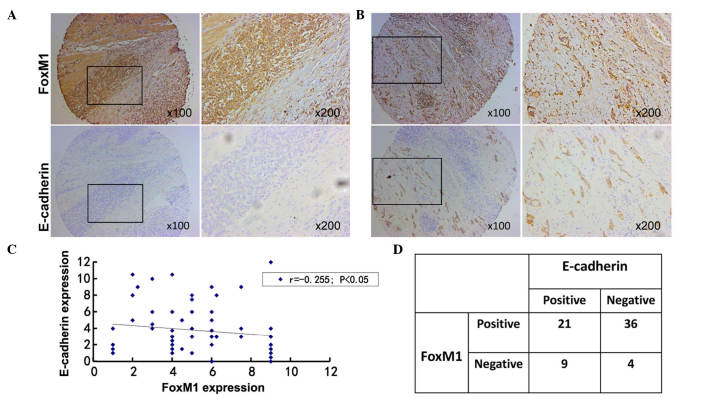
Co-expression of FoxM1 and E-cadherin expression in gastric cancer. (A) Immunohistochemical staining was performed with antibodies against FoxM1 and E-cadherin in gastric cancer tissue. Representative images of strongly-positive FoxM1 and negative E-cadherin staining are shown (magnification, ×100, and ×200 for the inserts). (B) Representative images of strong/moderate FoxM1 and moderate E-cadherin staining in gastric cancer sections are shown (magnification, ×100, and ×200). (C) A direct correlation between FoxM1 and E-cadherin expression in gastric cancer tissue was identified (n=70; Spearmans rank correlation test, r=−0.255; P=0.035). Of note, certain dots on the graph represent >1 sample (overlapped scores). (D) Summary of the expression of FoxM1 and E-cadherin in 70 gastric cancer samples. FoxM1, forkhead box M1.

