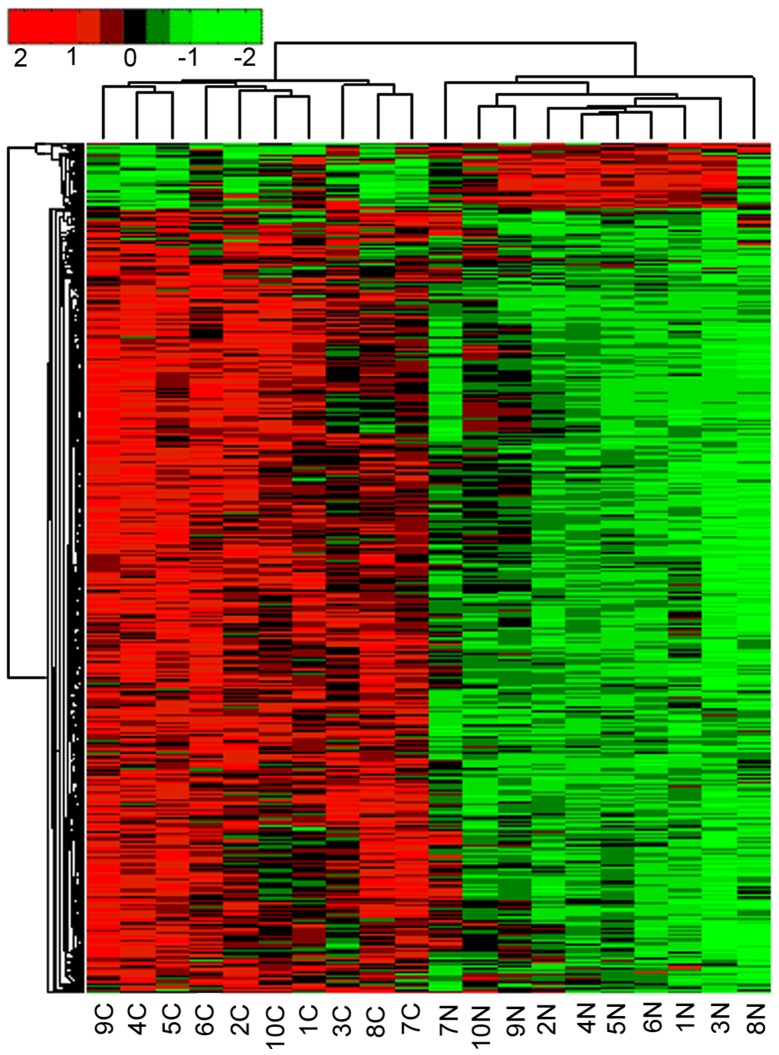
Figure 1.
Clustering analysis of differentially expressed genes in gastric cancer. The vertical axis represents 1666 differential genes and the horizontal axis shows the tissue samples. N indicates control tissues and C indicates cancer tissues. The red color represents upregulated genes and the green color represents downregulated genes. Genes with fold change ≥2 and P≤0.05 in gastric cancer vs. normal tissues were screened for the clustering.

