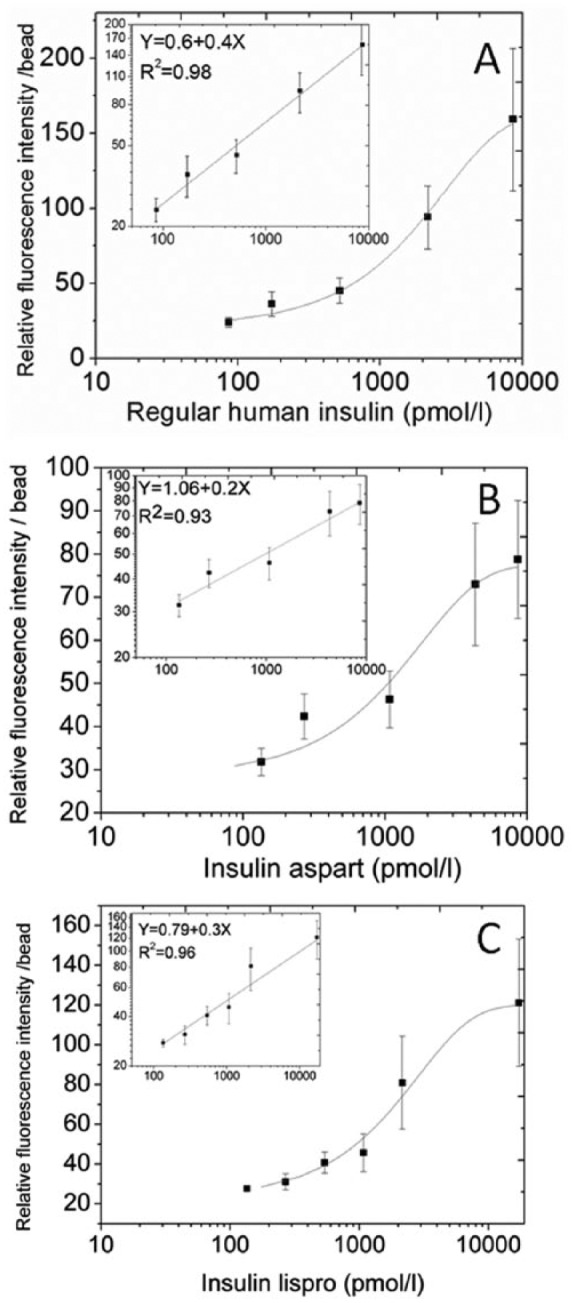
Figure 2.

Representative calibration curves of the microsphere based detection system. Each data point represents the mean ± standard deviation of the mean. (A) A calibration curve was obtained after preparation of a regular human insulin stock solution in a pool of heat inactivated serum and dilution of the stock in blocking buffer. Both a linear-log curve as well as a linear regression on a log-log curve (inset) are presented (B and C). Corresponding calibration curves obtained for (B) insulin aspart and (C) insulin lispro.
