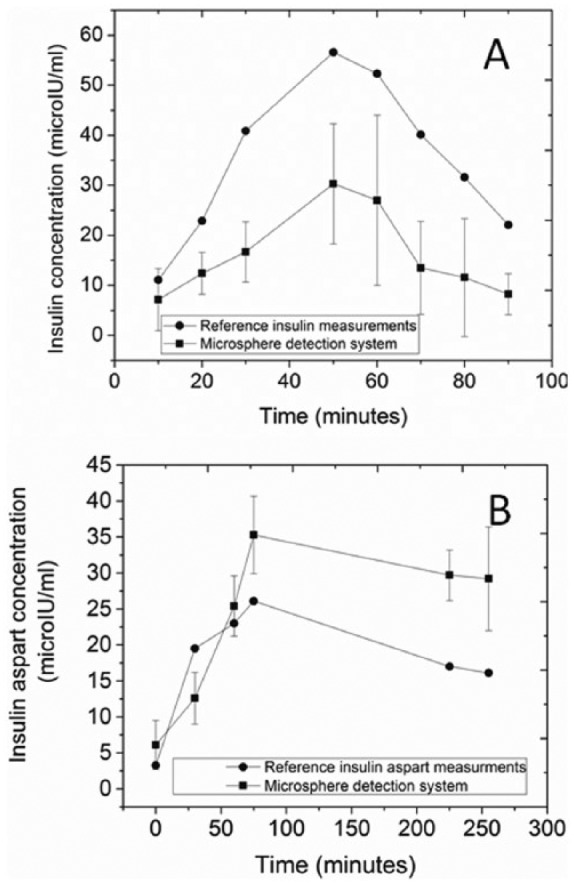
Figure 3.

Measurements of insulin in human plasma samples. Each data point represents the mean ± SD. (A) Regular human insulin detected in a subject without diabetes after consuming a high carbohydrate meal at time zero. Samples were collected every 10 minutes. Reference values (Abbot Architect insulin assay, solid circles) are compared to the microsphere detection system (solid squares). Each data point represents the mean ± SD for 6-9 subimages. (B) Insulin aspart detected in a subject with type 1 diabetes and no endogenous insulin production (C-peptide negative in a mixed-meal tolerance test) that received 5 units of insulin aspart at time zero. Reference values (Abbot Architect insulin assay, solid circles) are compared to the microsphere detection system (solid squares). Each data point represents the mean ± SD for 8-16 subimages.
