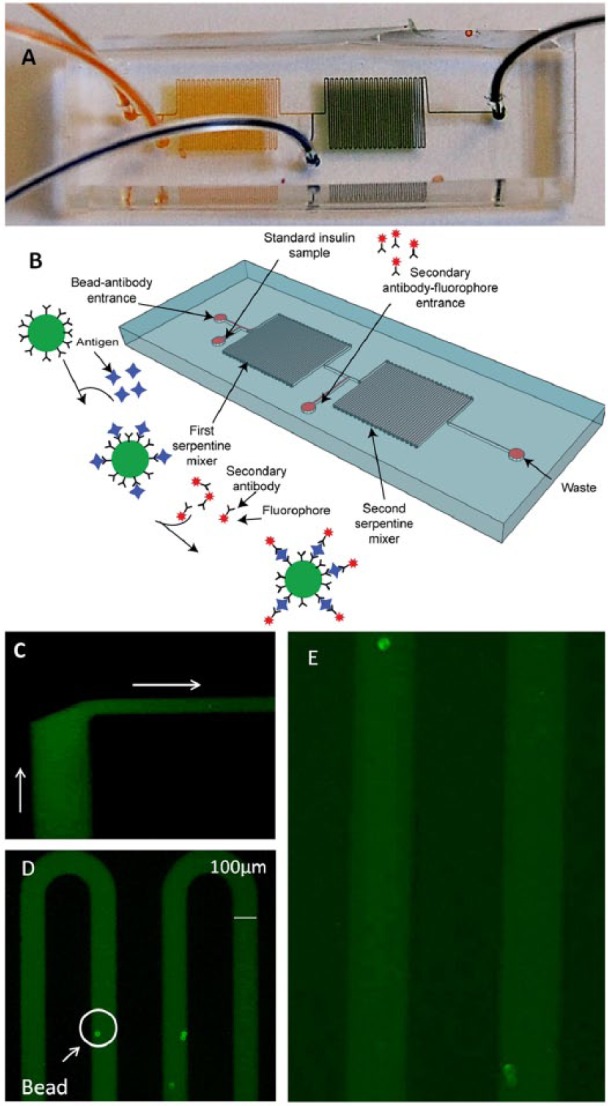
Figure 4.

Microfluidic device for detection of insulin. (A) Dye was injected into the microfluidic device to demonstrate the fluid path and mixing of the inputs; the yellow and the blue solutions mix to make green. (B) The sequence of events is as follows: microspheres conjugated with anti-insulin antibody and solution containing insulin are both introduced into the device through separate ports and allowed to mix in the first serpentine segment. Anti-insulin fluorescently labeled antibody is introduced between the first and second serpentine segments. The conjugated microspheres are imaged as they pass through the detection region. The products of the reaction are collected at the waste outlet port. (C) Introduction of fluorescent labeled antibody solution (from the bottom of the image) into the stream of bead-containing fluid (from the left of the image). The 2 fluids do not mix extensively until the beginning of the serpentine segment (20× magnification). (D) Detection of insulin by the appearance of fluorescence at the surface of the insulin antibody-conjugated microspheres in the second serpentine segment (10× magnification). 12.5 ng/ml (300 µIU/ml) of insulin was detected as a proof of concept (n = 19 beads). (E) The device was also used to detect 6.25 ng/ml (150 µIU/ml) of insulin (n = 14 beads) shown at higher magnification (~30×).
