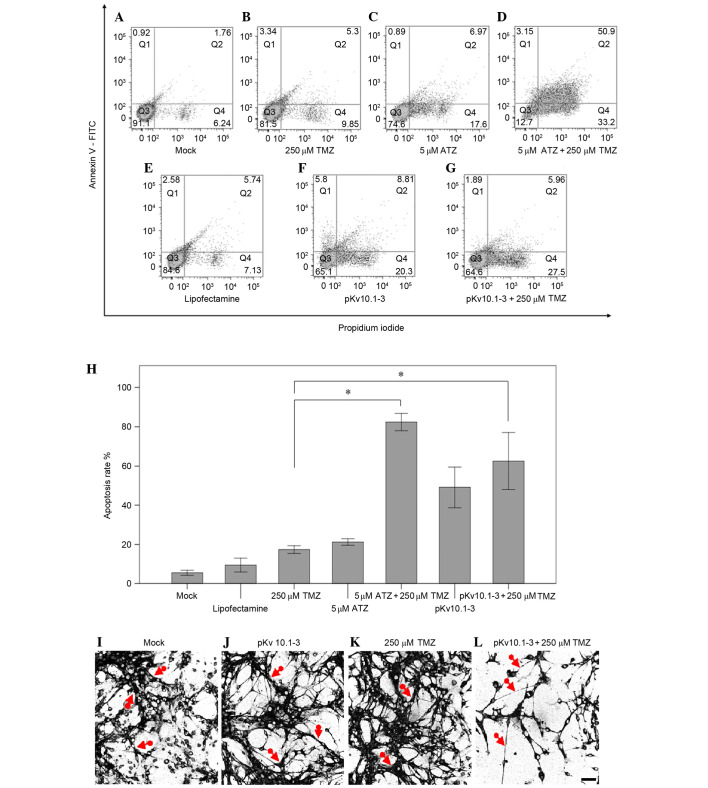
Figure 4.
Induction of apoptosis by Eag1 suppression in U87MG glioblastoma cells exposed to TMZ. (A-G) Experimental groups were analyzed after 72 h by Annexin V/propidium iodide (PI) assay, according to the manufacturer's protocol. Representative scatter plots are shown, indicating the distribution of Annexin V and PI-stained cells. The x-axis indicates PI fluorescence detected at 617 nm and the y-axis indicates Annexin V-fluorescein isothiocyanate fluorescence detected at 488 nm. Q3 indicate live cells, Q1 indicate necrotic cells, Q2 indicate late apoptotic cells and Q4 indicate early apoptotic cells. (H) Mean of sum of early and late apoptosis in U87MG cells. Results are expressed as a percentage of the total cell number and are presented as mean ± standard error of the mean. Assays were performed in triplicate of three independent experiments. *P<0.05. (I-L) Representative images acquired by confocal microscope. Binary images were obtained by phalloidin detection in U87MG monolayer cell culture and reveal morphological changes caused by different treatments. Red arrows indicate differences in cell filaments between the group treated with pKv10.1-3 and 250 µM TMZ, and the other groups. Scale bar, 20 µm. Q1-4, quadrant 1–4; TMZ, temozolomide.

