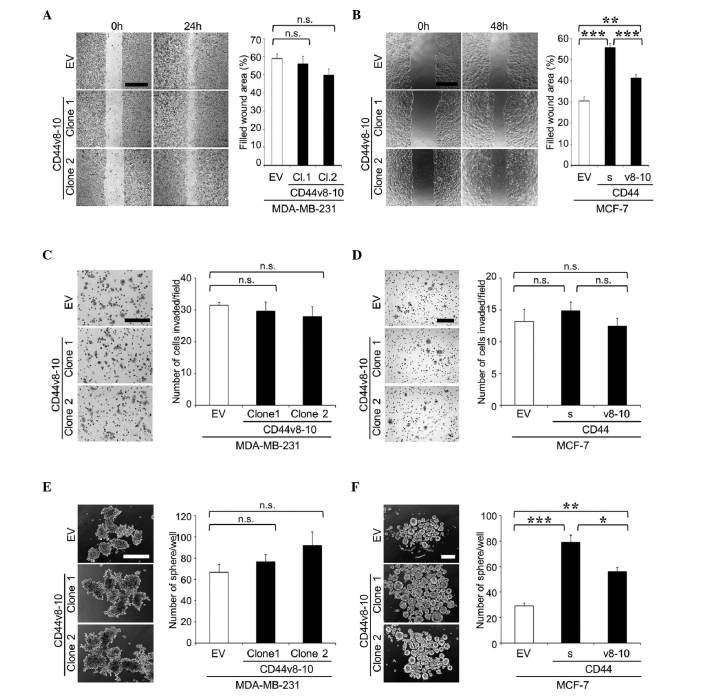
Figure 5.
Cell migration, cell invasion and tumor sphere formation of MDA-MB-231 and MCF-7 cell clones overexpressing CD44v8-10. (A and B) Cell migration of (A) MDA-MB-231 and (B) MCF-7 clones was determined by wound healing assay. Representative microscopic images at 0 and 24 h (MDA-MB-231) or 48 h (MCF-7) after wounding are shown on the left side of the panel (scale bar, 500 µm). Data are expressed as the percentage of filled wound area. **P<0.01, ***P<0.001 vs. control. (C and D) Cell invasion of (C) MDA-MB-231 and (D) MCF-7 clones was determined by matrigel invasion assay. Representative microscopic images of membranes are shown on the left side of the panel (scale bar, 200 µm). Data are expressed as the number of cells invaded/field. (E and F) Tumor sphere formation of (E) MDA-MB-231 and (F) MCF-7 clones in suspension cultures. Representative microscopic images are shown on the left side of the panel (scale bar, 200 µm). Data are expressed as the number of tumor spheres/well. *P<0.05, **P<0.01, ***P<0.001 vs. control. n.s., not significant; CD, cluster of differentiation; CD44v, variant isoform of CD44; EV, empty vector; Cl, clone; CD44s, standard isoform of CD44.

