
Figure 2.
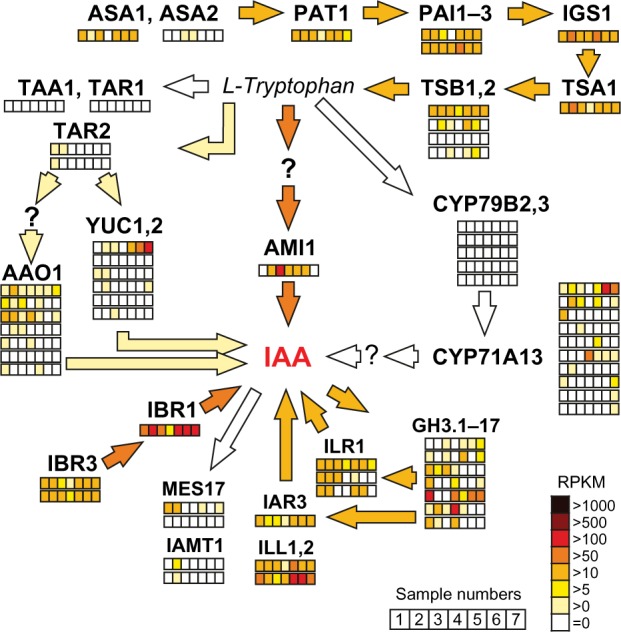
Expression of tomato genes encoding Trp and IAA biosynthesis enzymes. Major routes and enzyme activities involved in auxin biosynthesis are represented as in Figure 1B with focus on the expression of corresponding co-orthologues, genes identified in the tomato genome. Relative transcript levels in different tissues and developmental stages are shown in the color code as indicated in the right lower corner.
Notes: Analyzed samples in each row from left to right are: 1, root; 2, stem; 3, leaf; 4, flower; 5, fruit – mature green; 6, fruit – breaker stage; 7, fruit – ripening 10 days after turning red. Number and order of the rows at indicated co-orthologues corresponds to the presentation of expression data in Supplementary Table 15. Genes coding for enzyme activities not yet identified in tomato are indicated by question mark. Color intensities of the arrows from light to dark orange indicate the general pathway expression at low, moderate, and high levels, respectively.