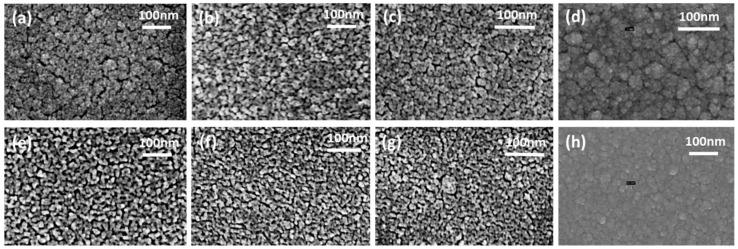
Figure 5.
SEM images of the crystalline structure of samples S0–S7: (a) SnO2 (S0); (b) SnO2/TiO2 bilayer structure 30 nm + 5 nm (S1); (c) SnO2/TiO2 bilayer structure 30 nm + 10 nm (S2); (d) SnO2/TiO2 bilayer structure 30 nm + 20 nm (S3); (e) SnO2/TiO2 multilayer 5% of TiO2 (S4); (f) SnO2/TiO2 multilayer 20% of TiO2 (S5); (g) SnO2/TiO2 multilayer 50% of TiO2 (S6); (h) TiO2 (S7).

