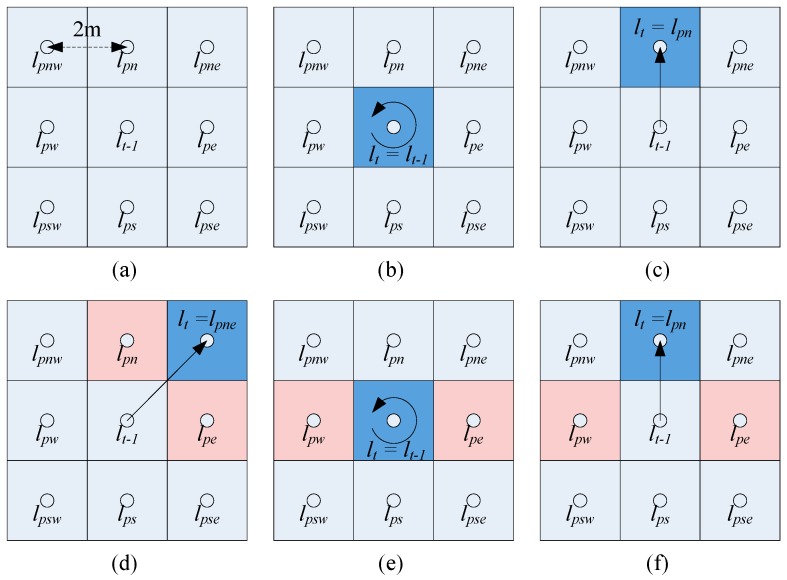
Figure 3.
Schematic of the fuzzy pattern recognition algorithm: (a) nine RPs in a grid area and the interval of the RPs is 2 m; (b) when the RSSI has no variation or a similar variation in four directions; (c) when the RSSI variation trend follows the trajectory from to ; (d) when the RSSI has a similar variation trend in the north and east, we assume the RSSI variations follow the trajectory from to ; (e) when the RSSI has a similar variation in the east and west; (f) when the RSSI has a similar variation in the east, west and north, we assume the RSSI variations follow the trajectory from to .

