Figure 7.

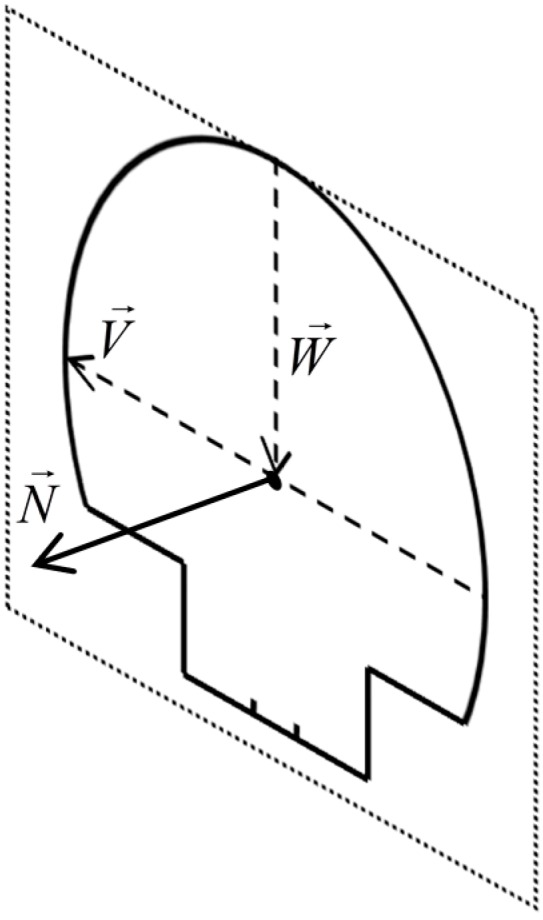
The calculation of a sample cross section’s normal vector (Section 4.1). The dashed rectangle represents the plane fitted to the cross section in Section 4.2.

The calculation of a sample cross section’s normal vector (Section 4.1). The dashed rectangle represents the plane fitted to the cross section in Section 4.2.