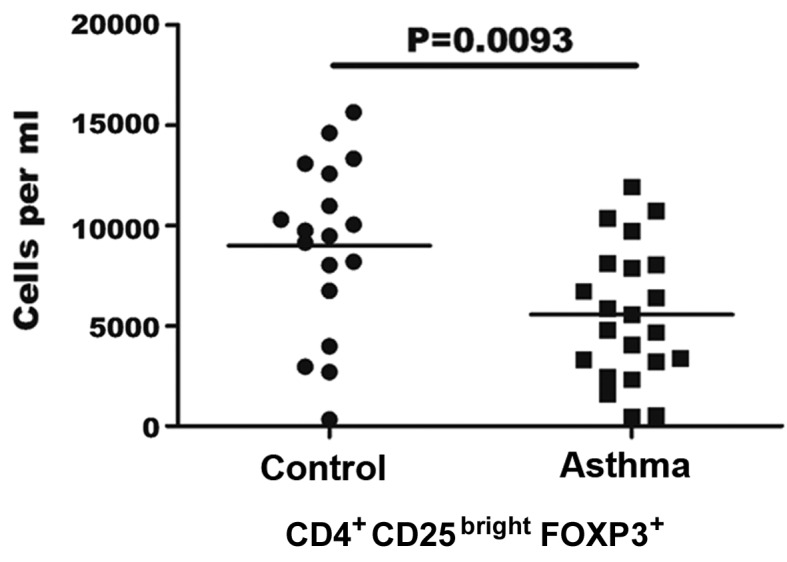
Figure 1.

Quantification of regulatory T (Treg) cells in asthma patients. Absolute number of Treg cells was calculated using lymphocyte counts and the frequency of CD4+ CD25bright FOXP3+ cells determined by flow cytometry. Each point represents an individual patient sample. The horizontal line represents the mean values for each group. FOXP3, forkhead box P3.
