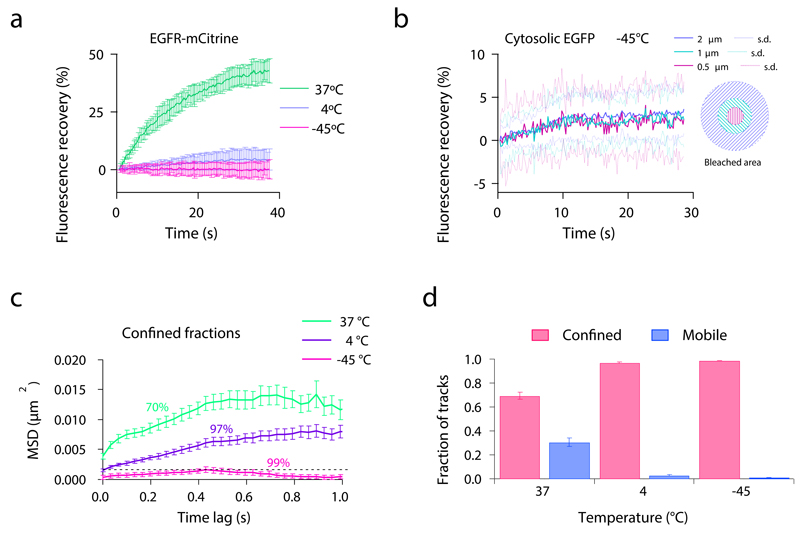
Figure 2. Protein diffusion before and during cryo-arrest.
(a) Fluorescence recovery after photobleaching (FRAP) of EGFR-mCitrine expressed in HeLa cells at different temperatures during the cryo-arrest protocol. Shown are fluorescence recovery curves obtained at 37°C (n=11 cells), 4°C (n=19) and -45°C (n=19) after bleaching a 2 μm spot on the plasma membrane. (b) FRAP of cytoplasmic eGFP expressed in HeLa cells at -45°C. Shown are the fluorescence recovery curves measured in concentric areas within the bleached spot (an innermost circle with a diameter of 0.5 μm, an intermediate circle with 1 μm and the full bleached area with a diameter of 2 μm; n=20 cells. (c, d) Single molecule tracking of Cy3-SNAP-EGFR in HeLa cells measured at 37°C (n=10 cells), 4°C (n=14) and -45°C (n=14). (c) Mean squared displacement (MSD) of the confined fractions of Cy3-SNAP-EGFR. Numbers represent the percentage of molecules that are included in this confined fraction. (d) Fractions of detected molecule tracks that are classified as confined and mobile. (a, b) mean ± s.d., (c, d) mean ± s.e.m. All data was obtained from 3 independent experiments.

