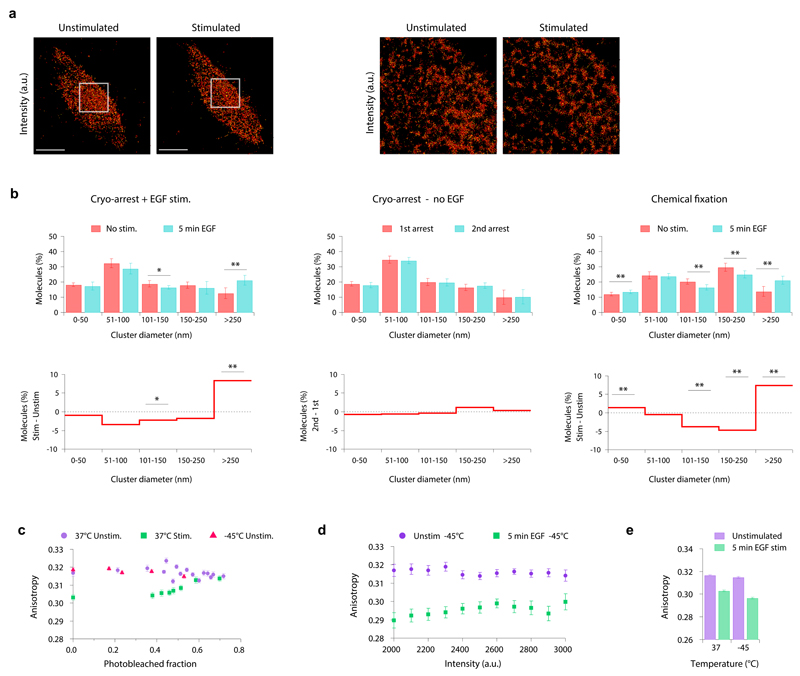
Figure 5. Nanoscale organization of EGFR in the plasma membrane.
(a, left) Representative TIRF-PALM image (localization intensity) of EGFR-mEos2 in the same cryo-arrested HeLa cell, before and 5 min after EGF stimulation. (a, right) detailed view of the selected areas marked in the left images. Scale bars: 10 µm (b) Density-based spatial cluster analysis using a neighborhood radius of 40 nm of the EGFR-mEos2 distribution in cryo-arrested HeLa cells. Upper row: fraction of molecules in clusters of different diameters. Lower row: fraction of molecules shown as differential plot between the compared conditions. Left column: before (red) and 5 min after EGF stimulation (blue); middle column: unstimulated cells that were cryo-arrested twice with an interval of 5 min; right column: chemically fixed cells before (red) and 5 min after EGF stimulation (blue). (mean ± s.d.; n=8 cells per condition; *: p<0.05; **p<0.01 using two sample KS-test) (c) Mean fluorescence anisotropy of EGFR-QG-mCitrine in HeLa cells as a function of its bleached fraction. Data obtained at 37°C before (purple, n=7) and 5 min after EGF stimulation (green, n=12) or at -45°C for unstimulated cryo-arrested cells (red, n=10) (d) Mean fluorescence anisotropy of EGFR-QG-mCitrine in cryo-arrested HeLa cells as a function of its binned fluorescence intensity (n=12), before (purple) and 5 min after EGF stimulation (green). (e) Fluorescence anisotropy per cell before and 5 min after EGF stimulation at 37°C (n=16) and at -45°C (n=12). Data in (c)-(e): mean ± s.e.m.

