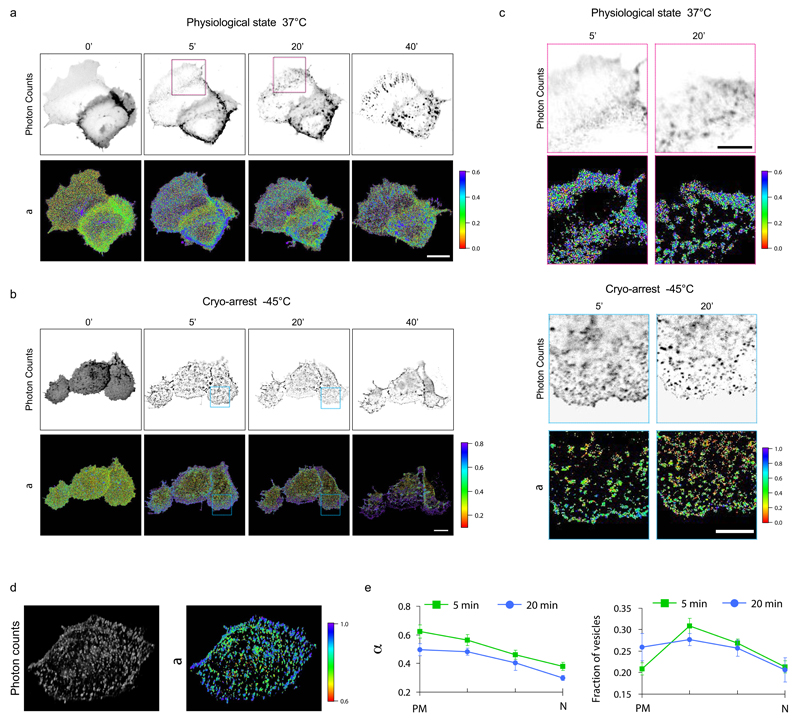
Figure 6. Evolution of LIFEA2 activity patterns monitored during reversible cryo-arrest.
(a) Confocal FLIM measurements of LIFEA2 activation in Cos7 cells upon stimulation with pre-clustered ephrinA1-Fc (2 µg mL-1) for the indicated time (minutes) at 37°C. Upper row: representative images of LIFEA2 donor (mCitrine) photon count, lower row: fraction of LIFEA2 in the active conformation (α). (b) Same as above, but Cos7 cells were cryo-arrested at -45°C at the indicated time points following the scheme depicted in figure 3a. (c) Magnified insets from respective donor photon count and α-maps masked for defined structures (see Online Methods for details) at the indicated time (a, magenta boxes) and (b, blue boxes). (d) Volume representation of a deconvolved confocal FLIM z-scan (Imaging time: 37 min) through a representative HeLa cell cryo-arrested 5 min after stimulation with pre-clustered ephrinA1-Fc. Left: LIFEA2 donor (mCitrine) photon count; right: α (e) Quantification of α on vesicles (left) and fraction of vesicles (right) in 4 concentric radial bins of equivalent area (compare Supplementary Fig. 9b). PM: outermost bin close to the plasma membrane; N: innermost bin around the nucleus. Data: mean ± s.e.m. (n=9 cells from 4 time series). Scale bars: a,b = 20 µm; c = 10 µm.

