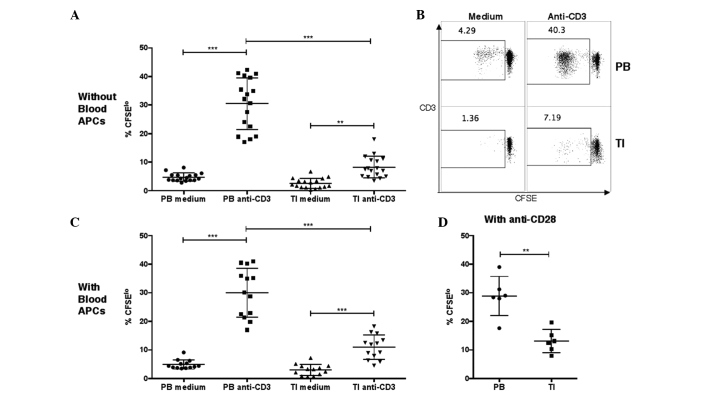
Figure 2.
Proliferation of T cells in PB or TI cells, as measured by CFSE staining. (A and B) Percentages of CFSElo cells in PB or TI CD3+ T cells in unstimulated medium or after stimulation with anti-CD3 antibodies. PB mononuclear cells or tumor leukocytes were labeled with CFSE and then incubated in medium without or with 2 µg/ml anti-human CD3 monoclonal antibody at 105 cells per well in a 96-well plate. The cells were harvested at day 6 and the percentages of CFSElo cells among the CD3+ cells were examined by flow cytometry (one-way analysis of variance, followed by Tukey's multiple comparisons test; ***P<0.001 and **P<0.01). (C) Percentages of CFSElo cells in PB or TI T cells in unstimulated medium or after stimulation with anti-CD3 antibodies, with addition of purified APCs from autologous PB samples. Purified autologous APCs were added prior to CFSE labeling (one-way analysis of variance, followed by Tukey's multiple comparisons test; ***P<0.001). (D) Percentages of CFSElo cells in PB or TI T cells after stimulation with anti-CD3 and anti-CD28 monoclonal antibodies. The anti-human CD28 monoclonal antibodies were added together with anti-CD3 antibodies (unequal variances t-test; **P<0.01). GBM, glioblastoma; CD, cluster of differentiation; TI, tumor-infiltrating; PB, peripheral blood; CFSE, carboxyfluorescein succinimidyl ester; APC, antigen-presenting cell.

