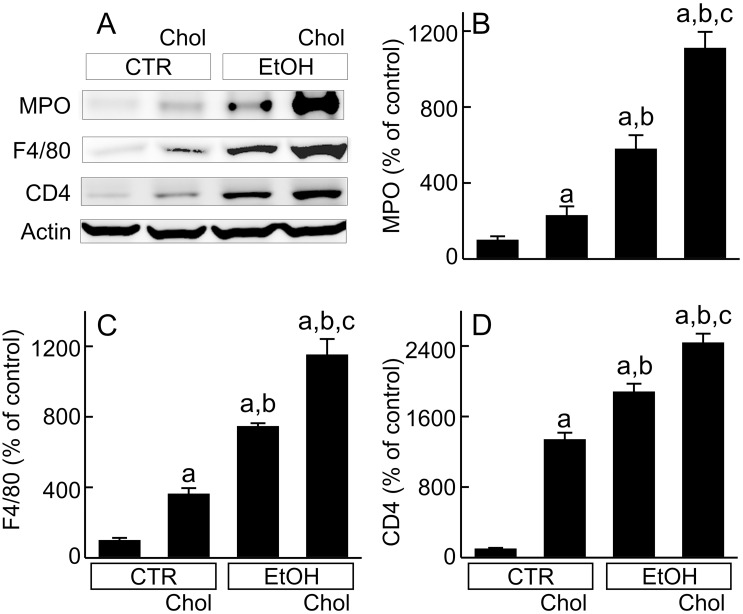
Fig 4. Combined ethanol and cholesterol feeding increases leukocyte infiltration in the liver.
Mice were fed CTR, Chol, EtOH and EtOH+Chol diets for 3 months. A, representative immunoblots of MPO, F4/80, CD4 and actin. B, quantification of MPO immunoblots by densitometry. C, quantification of F4/80 immunoblots. D, quantification of CD4 immunoblots. Values are means ± S.E.M. a, p < 0.05 vs CTR; b, p < 0.05 vs Chol; c, p < 0.05 vs EtOH (n = 4 per group).

