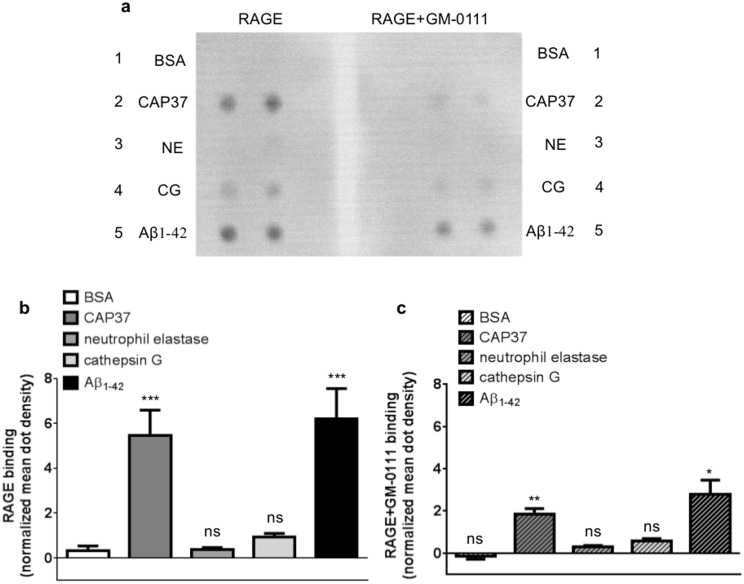
Fig 3. Far-Western dot blotting confirms the binding of RAGE to neutrophil proteins and inhibition of binding with GM-0111.
(a) Far-Western dot blots show the binding of RAGE to BSA (row 1), CAP37 (row 2), neutrophil elastase (NE, row 3), cathepsin G (CG, row 4), and Aβ1–42 (row 5) when RAGE was pre-incubated in the absence (left) or presence (right) of the RAGE inhibitor, GM-0111. Proteins were spotted in duplicate on each blot. (b) Histogram quantification of RAGE binding to BSA, CAP37, neutrophil elastase, cathepsin G, and Aβ1–42 is represented by the white bar, dark gray bar, medium gray bar, light gray bar, and black bar, respectively. BSA: n = 9, CAP37: n = 9, neutrophil elastase: n = 6, cathepsin G: n = 6, Aβ1–42: n = 8. Data are mean ± SEM of results. Mean dot densities were normalized to the mean dot densities of ponceau S staining for each dot. A Kruskal-Wallis test was performed with Dunn’s multiple comparisons test to compare the binding of RAGE to each neutrophil protein with the binding of RAGE to BSA. (c) Histogram quantification of RAGE (pre-incubated with GM-0111) binding to BSA, CAP37, neutrophil elastase, cathepsin G, and Aβ1–42 is represented by the striped white bar, striped dark gray bar, striped medium gray bar, striped light gray bar, and striped black bar, respectively. BSA+GM-0111: n = 8, CAP37+GM-0111: n = 8, neutrophil elastase+GM-0111: n = 5, cathepsin G+GM-0111: n = 5, Aβ1–42+GM-0111: n = 7. Data are mean ± SEM of results. Mean dot densities were normalized to the mean dot densities of ponceau S staining for each dot. Asterisks (*) indicate significant results from student’s unpaired t tests, which were used to compare binding of RAGE to each protein in the absence and presence of GM-0111.

