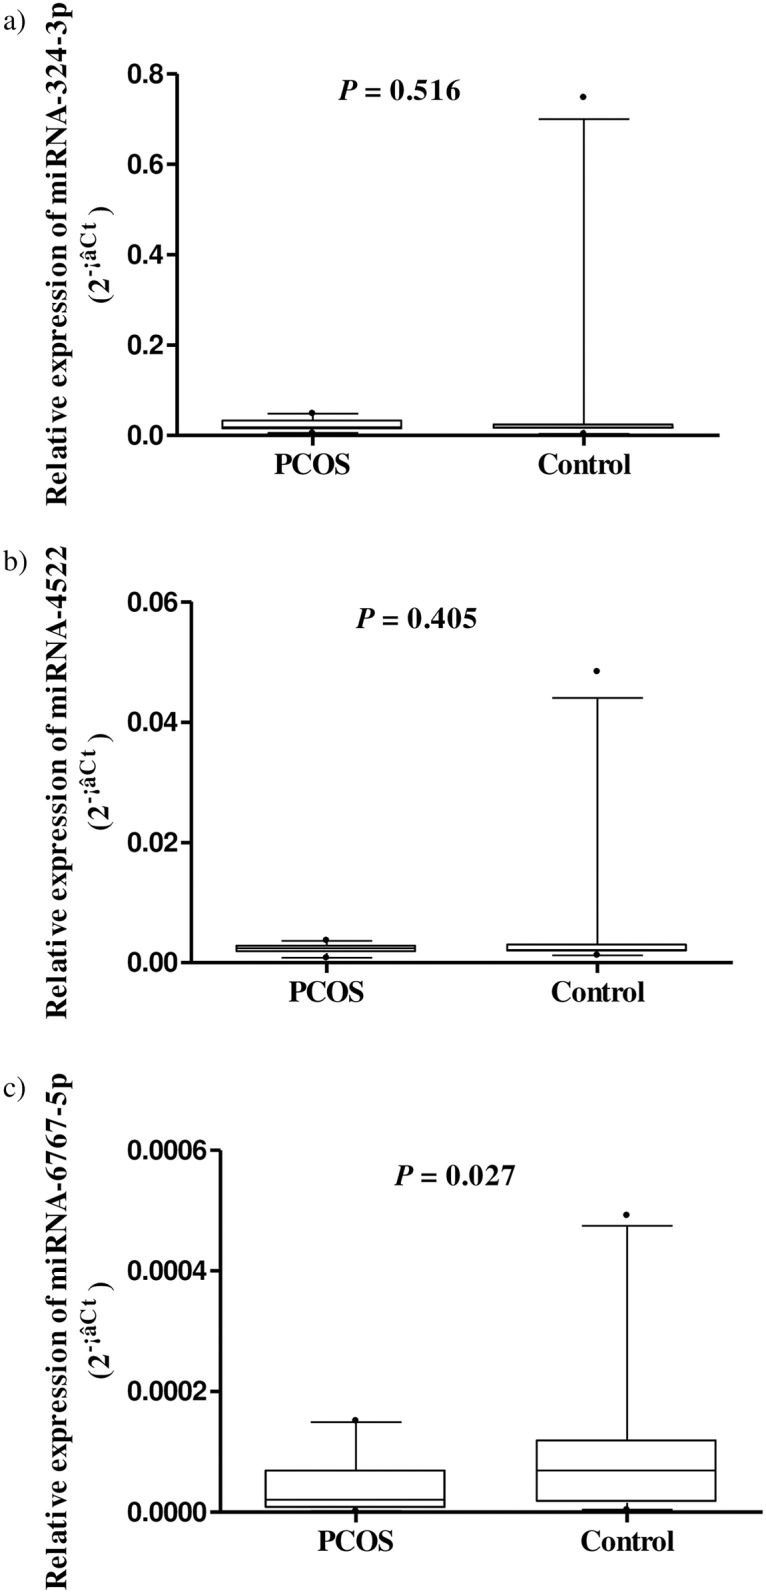
Fig 1. A boxplot for the relative expression of serum miRNAs in women with PCOS and control subjects from the quantitative real-time polymerase chain reaction analysis.

(a-c) For each miRNA, the line inside the box is the median. The top and bottom lines of the box are the first and third quartiles, respectively. The top and bottom whiskers are the 5th and 95th percentiles, respectively. Any data beyond these whiskers were shown as cycles. miRNA, microRNA; PCOS, polycystic ovary syndrome; Ct, the threshold cycle.
